• Der Wirtschaftsaufschwung, der 2021 einsetzte und sich in den ersten Monaten des Jahres 2022 fortsetzte, führte zusammen mit angebotsseitigen Beschränkungen im Transportsektor zu einem Anstieg der Frachtraten im Seeverkehr und damit zu einer höheren Inflation.
• Der russische Angriffskrieg gegen die Ukraine führte zu einem weiteren Anstieg der Rohstoffpreise und zur Unsicherheit über das künftige Wirtschaftswachstum. Die Öl- und Gaspreise werden in 2022 voraussichtlich um 55% bzw. 147% an Wert gewinnen. Die Kohlenachfrage und damit die Kohlepreise werden 2022 aufgrund des europäischen Embargos für russische Kohle ebenfalls stark ansteigen.
• Für das Jahr 2022 wird ein Rückgang des BIP im Euroraum um 2,8% erwartet, vorausgesetzt, der Krieg bleibt auf die Ukraine beschränkt.
Das Jahr 2021 und der Beginn des Jahres 2022 zeigten eine stabile Erholung der Weltwirtschaft von der Pandemie. Dennoch hat der russische Angriffskrieg gegen die Ukraine1 zu einer erheblichen Verlangsamung des erwarteten Wachstums und zu einer kostspieligen humanitären Krise geführt.
Bereits im Jahr 2021 traten im Verkehrssektor angebotsseitige Beschränkungen in Form von überlasteten Seehäfen und Seeschifffahrtswegen auf. Zusammen mit der raschen Erholung im Jahr 2021 führten diese Faktoren zu einem Anstieg der Frachtraten im Seeverkehr und damit zu einem weiteren Anstieg der Inflationsraten.2
Infolge des Krieges wurden die ukrainischen Seehäfen geschlossen, wodurch die Ausfuhr von ukrainischem Getreide und anderen Rohstoffen blockiert wurde. Auch der Handel und die Warenströme (z. B. Kohle) aus Russland wurden stark eingeschränkt.
Die gegen Russland verhängten Handels- und Finanzsanktionen führten zu Einschränkungen bei der Energieversorgung der mittel- und westeuropäischen Länder, wodurch sich der Inflationstrend noch weiter verstärkte. Die Rohstoffpreise, insbesondere auf dem Lebensmittel- und Energiemarkt, steigen rasant an.
Das globale Wachstum (BIP) wird sich von schätzungsweise 6,1% im Jahr 2021 auf 3,6% in den Jahren 2022 und 2023 abschwächen. Diese Prognose geht davon aus, dass der Krieg auf die Ukraine beschränkt bleibt. Das Wachstum des Welthandels dürfte sich insbesondere im Jahr 2022 von schätzungsweise 10,1% im Jahr 2021 auf 5,0% im Jahr 2022 und weiter auf 4,4% im Jahr 2023 abschwächen.
Das Wachstum des Bruttoinlandsprodukts (BIP) der Eurozone wurde auf 2,8% nach unten korrigiert und liegt damit 1,1 Prozentpunkte unter der Prognose vom Januar 2022. Die Wirtschafts- und Geldpolitik steht vor einem schwierigen Kompromiss zwischen der Bekämpfung der Inflation und der Steigerung des Wirtschaftswachstums. Die Bekämpfung der Inflation erfordert eine Anhebung der Zinssätze, was jedoch höhere Finanzierungskosten und damit geringere private Investitionen und ein niedrigeres Wachstum bedeuten würde.
ABBILDUNG 1: PROZENTUALE VERÄNDERUNG DES BIP, KONSTANTE PREISE (IN %)
Quelle: IMF World Economic Outlook Database, Outlook April 2022
HANDEL
Durch den Krieg in der Ukraine werden die Handelsströme zunehmend gestört. Unterbrechungen der Lieferketten und den Mangel an Komponenten für die industrielle Produktion gab es bereits vor dem Krieg in der Ukraine. Dies schadet einigen Branchen, darunter auch der Automobilindustrie.
Diese Störung geht über Rohstoffe hinaus: Ein Beispiel ist die Produktion von Neongas, die sich in Russland und der Ukraine konzentriert. Neongas wird für die Herstellung von Halbleitern aus Silizium benötigt und ist daher für die Automobil-, Elektronik- und IT-Industrie unerlässlich. Darüber hinaus ist die weltweite Autoproduktion in hohem Maße von einem elektronischen Bordnetz abhängig, das in der Ukraine hergestellt wird, sowie von Metallen wie Palladium und Nickel, die in Russland produziert werden.
Eine wichtige wirtschaftliche Folge der Unterbrechung der Handelsströme ist, dass die Preise für fast alle Arten von Rohstoffen steigen. Dies betrifft nicht nur Getreide (auf Russland und die Ukraine entfallen rund 30% der weltweiten Weizenexporte), sondern auch Kohle, Rohöl, Mineralien und Metalle.
ROHSTOFFPREISE UND IHRE AUSWIRKUNGEN AUF DIE BINNENSCHIFFFAHRT (IWT)
ROHÖL
Die Terminmärkte deuten auf einen raschen Anstieg der Öl- und Gaspreise im Jahr 2022 hin (55% bzw. 147%) und dann auf einen Rückgang im Jahr 2023, wenn sich die Versorgung anpasst. Für die Binnenschifffahrt haben hohe Ölpreise eine doppelte Wirkung. Auf der Nachfrageseite führen sie zu einer geringeren Beförderungsnachfrage nach Erdölerzeugnissen, während auf der Angebotsseite hohe Ölpreise zu höheren Kraftstoffkosten führen, die mindestens ein Viertel der gesamten Betriebskosten in der Binnenschifffahrt ausmachen.
ABBILDUNG 2: ROHSTOFFPREISINDIZES (2016 = 100) *
Quelle: IWF (April 2022)
* Kohle umfasst südafrikanische und australische Kohle. Getreide umfasst Weizen, Mais, Reis und Gerste. Metalle umfassen Kupfer, Aluminium, Eisenerz, Zinn, Nickel, Zink, Blei und Uran. Rohöl: Einfacher Durchschnitt von drei Spotpreisen (Dated Brent, West Texas Intermediate, Dubai Fateh).
KOHLE
Der sprunghafte Anstieg der Kohlepreise im Jahr 2022 spiegelt einen starken Aufwärtstrend bei der Kohlenachfrage wider, der auf das angespannte Verhältnis zwischen Angebot und Nachfrage sowie auf den von der EU verhängten Importstopp bei russischer Kohle zurückzuführen ist. Bereits im Jahr 2021 hat der Kohletransport auf dem Rhein aufgrund der hohen Gaspreise um fast 29% zugenommen (siehe Kapitel 2).
Im Jahr 2020 deckte Russland 55% der Kohleeinfuhren der Europäischen Union und 16% des Weltkohlebedarfs.3 Im Falle einer anhaltend hohen Kohlenachfrage und einer Blockade der russischen Kohle in den kommenden Jahren könnte die Kohlenachfrage durch Importe aus anderen Kohlelieferländern wie Australien, den Vereinigten Staaten, Kanada und Südafrika gedeckt werden.
Auch der Kohletransport auf der Donau war teilweise auf Kohle aus Russland angewiesen. Dies galt auch für die Stahlindustrie in Ungarn. Die logistische Kette, die russische Kohle über den Seehandel und den Hafen von Constanţa nach Ungarn brachte, wurde jedoch 2022 aufgegeben und durch eine Transportkette ersetzt, die den Seehafen Koper in Slowenien und den Hinterlandtransport auf der Schiene einschloss.
GETREIDE
Nach Angaben des IWF zu den Rohstoffpreisen,4 sind die Preise für alle Getreidesorten zwischen 2020 und 2022 um rund 85% gestiegen, was auf die steigende Nachfrage nach Lebensmitteln während der Covid-Krise und den Krieg in der Ukraine zurückzuführen ist.
Die Ukraine ist einer der weltweit wichtigsten Exporteure von Getreide und Ölsaaten. Nach Angaben von Eurostat5 importierte die EU-27 im Jahr 2021 8,0 Millionen Tonnen Getreide aus der Ukraine und 1,1 Millionen Tonnen aus Russland. Die Getreideexporte über ukrainische und rumänische See- und Flusshäfen sind für die Ernährungssicherheit in Nordafrika, Asien und dem Nahen Osten von entscheidender Bedeutung.
Der Krieg in der Ukraine wirkt sich negativ auf die Ernte- und Exportmengen für Getreide aus Russland und der Ukraine aus. Der Getreideexport über die Seehäfen am Schwarzen Meer macht 98% aller ukrainischen Getreideexporte aus. Für die Ausfuhr von Getreide aus der Ukraine müssen alternative Exportrouten gefunden werden. Ein solcher Weg ist die Eisenbahnlinie nach Rumänien. Die Kapazität der Bahnlinie kann jedoch die großen Mengen, die über die Seehäfen exportiert werden, nicht abdecken.6
Zu den Lösungen für den Getreideexport aus der Ukraine gehören der Transport per Bahn und Straße zu den ukrainischen Flusshäfen Reni und Izmaïl, zum moldawischen Flusshafen Giurgiulești und zu rumänischen Flusshäfen wie Brăila oder Galați. In diesen Häfen kann das Getreide dann auf Flussschiffe oder auf kleine Seeschiffe verladen werden. Im ersten Fall können Flussschiffe das Getreide bis zum Seehafen Constanța transportieren, wo es auf Seeschiffe mit großer Kapazität verladen wird. Im zweiten Fall können kleine Seeschiffe das Getreide zwischen den Flusshäfen und den Zielorten in Nordafrika mit oder ohne weiteren Umschlag in Constanța transportieren.
In Bezug auf den Schienentransport von Getreide zu den oben genannten Häfen ist zu erwähnen, dass es Unterschiede in der Spurweite zwischen der Ukraine und den meisten Teilen der EU-277 gibt. Dies gilt jedoch weder für die ukrainischen Häfen Reni und Izmaïl,8 noch für den Hafen Galați in Rumänien, der mit der gleichen Breitspur wie in der Ukraine ausgestattet ist.
Die Getreideeinfuhren für die nordafrikanischen Länder werden auch durch Ausfuhren aus den Ländern der mittleren Donau (Ungarn, Serbien) über den Wasserweg auf der Donau und den Seeverkehr zwischen Constanţa und Nordafrika gedeckt. Als Reaktion auf steigende Getreidepreise und geringere Einfuhren aus der Ukraine hat Ungarn jedoch im März 2022 Ausfuhrkontrollen für Weizen eingeführt. In Serbien wurde im selben Monat eine Ausfuhrkontrollregelung mit Quoten eingeführt. Diese Regelung umfasst Ausfuhrkontrollen für Weizen, Mais, Mehl und raffiniertes Sonnenblumenöl. Dies kann als Reaktion auf eine erwartete Verknappung von Sonnenblumenöl aufgrund geringerer Importe aus der Ukraine gesehen werden.
• Der Güterverkehr auf dem Rhein spielt für die Schweiz eine wichtige Rolle. Rund 25% aller von der Schweiz importierten Mineralölprodukte werden über den Rhein geliefert.
• Der Passagierverkehr auf den europäischen Binnenwasserstraßen ist ein Sektor, in dem die Schweiz eine wichtige Rolle in Europa spielt. Dies spiegelt sich in hohen Beschäftigungs- und Umsatzzahlen sowie in einer hohen Anzahl von Schweizer Flusskreuzfahrt- und Ausflugsschiffen wider.
DIE BINNENSCHIFFFAHRT IN DER SCHWEIZ
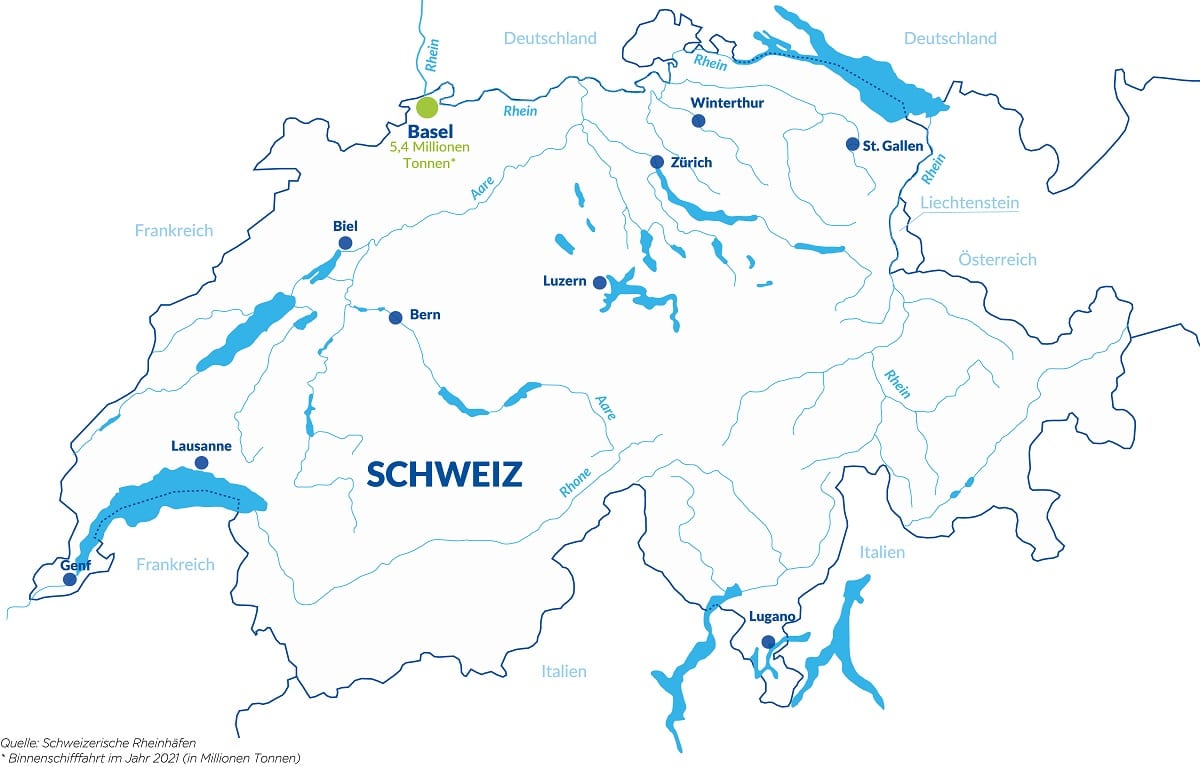
ENTWICKLUNG DER BINNENSCHIFFFAHRT IN DEN SCHWEIZERISCHEN RHEINHÄFEN IN BASEL
Das größte Gütersegment innerhalb des wasserseitigen Güterverkehrs in den Schweizerischen Rheinhäfen sind die Mineralölprodukte, mit einem durchschnittlichen Anteil von 45% in den letzten zehn Jahren. Bei fast allen in Basel umgeschlagenen Mineralölprodukten handelt es sich um Einfuhren in die Schweiz. Der Anteil der Importrichtung lag 2021 bei 98,5%, 2020 bei 99,0% und war in den Vorjahren ähnlich hoch.
ABBILDUNG 1: JÄHRLICHER BINNENSCHIFFSVERKEHR IN DEN SCHWEIZERISCHEN RHEINHÄFEN (IN MILLIONEN TONNEN)
Quelle: Schweizerische Rheinhäfen
Die Schweiz ist bei der Einfuhr von Rohöl und Mineralölprodukten auf mehrere Verkehrsträger angewiesen. Der Modal Split-Anteil des Rheins an diesen Importen betrug 24,6% im Jahr 2020 und 23,4% über den gesamten Zeitraum von 2011 bis 2020. Pipelines hatten mit 36,7% im Jahr 2020 den höchsten Anteil. Der Grund dafür ist, dass Rohöl vollständig über Pipelines importiert wird.
ABBILDUNG 2: EINFUHREN VON ROHÖL UND ERDÖLPRODUKTEN IN DIE SCHWEIZ NACH VERKEHRSTRÄGER (IN %)
Quelle: ZKR-Analyse auf der Grundlage von Avenergy Suisse
Bei einer weiteren Differenzierung der Mineralölprodukte zeigt sich, dass der Rhein hohe Modal Split-Anteile bei der Einfuhr von Diesel und Heizöl erreicht.
ABBILDUNG 3: MODAL SPLIT-ANTEIL DES RHEINS BEI DER EINFUHR VON ROHÖL UND ERDÖLERZEUGNISSEN IN DIE SCHWEIZ NACH ART DER ERZEUGNISSE (IN %)*
Quelle: ZKR-Analyse auf der Grundlage von Avenergy Suisse. Modal Split-Anteil des Rheins an allen Verkehrsträgern (Pipeline, Schiene, Rhein, Straße, Luftweg)
Der Basler Hafen ist auch ein wichtiger Ort für den wasserseitigen Containerumschlag. Der Containertransport hatte 2019 mit über 120.000 TEU an wasserseitigem Containerumschlag einen ersten Höhepunkt erreicht. Die Covid-Krise brachte dem Containertransport nur einen geringen Verlust von 5% (Stand 2020 gegenüber dem Stand 2019). Im Jahr 2021 erholte sich der Containerverkehr und erreichte mit 121.046 TEU (+9,8% gegenüber 2020) ein neues Rekordniveau. Die Schweizerischen Rheinhäfen investieren in weitere Kapazitäten für den Containerumschlag, um die für die Zukunft prognostizierten steigenden TEU-Mengen bewältigen zu können.
ABBILDUNG 4: WASSERSEITIGER CONTAINERTRANSPORT IN DEN SCHWEIZERISCHEN RHEINHÄFEN (IN TEU)*
Quelle: ZKR-Analyse auf Grundlage der Schweizerischen Rheinhäfen
* Hinweis: Für die Jahre 2014-2017 wurden die Zahlen korrigiert, um die 20.000 TEU zu berücksichtigen, die von Lkw auf die Schiene umgeladen wurden.
INFORMATIONSBLATT BINNENSCHIFFFAHRT IN DER SCHWEIZ – JÄHRLICHE ZAHLEN
Quellen: ZKR-Analyse auf der Grundlage von Eurostat-Daten [sbs_na_1a_se_r2], [iww_go_qnave], OECD-Kurzzeitindikatoren, Donaukommission (Flottendaten)
Anmerkungen zum Informationsblatt:
„Anteil an gesamter EU“ enthält Zahlen für die EU plus Schweiz und Serbien. #) Im Gegensatz zur Verkehrsleistung kann für das Transportvolumen kein länderspezifischer Anteil berechnet werden.
Der Modal Split-Anteil ist definiert als der prozentuale Anteil der Güterverkehrsleistung der Binnenschifffahrt (in TKM) an der gesamten landbasierten Verkehrsleistung. Zu den landbasierten Güterverkehrsträgern gehören Straße, Schiene und Binnenschifffahrt. Der Straßengüterverkehr wird nach dem Territorialitätsprinzip erfasst, d. h. die Daten über den grenzüberschreitenden Straßengüterverkehr werden nach den nationalen Gebieten aufgeteilt, in denen der Verkehr tatsächlich stattfindet. Diese Grundsätze werden in der Eurostat-Reihe [tran_hv_frmod] umgesetzt.
• Die Schifffahrtsbedingungen waren in den ersten sechs Monaten des Jahres 2021 mehr oder weniger normal. Im Juli 2021 war der Rhein von Hochwasser betroffen. Im Oktober und November 2021 gab es sowohl auf dem Rhein als auch auf der Donau Niedrigwasser.
• Die Kraftstoffpreise stiegen aufgrund des starken Anstiegs der Ölpreise. Die Frachtraten stiegen ebenfalls an, wobei der Trend bei Trockengütern und Containern positiver ausfiel als bei Flüssiggütern.
Was den Hafenbetrieb betrifft, so deuten die monatlichen Daten für den wasserseitigen Güterumschlag in den größten Oberrheinhäfen auf einen leichten Erholungstrend hin, der in der zweiten Jahreshälfte 2020 begann und sich im gesamten Jahr 2021 fortsetzte. Allerdings wurde diese Erholung durch das starke Niedrigwasser im Oktober und November 2021 unterbrochen.
ABBILDUNG 1: WASSERSEITIGER GÜTERUMSCHLAG IN WICHTIGEN HÄFEN AM OBERRHEIN (IN MILLIONEN TONNEN)
Quelle: ZKR-Auswertung basierend auf Hafendaten
Bezüglich der Wasserführung zeigt Abbildung 2 Daten für den verfügbaren Tiefgang bei Kaub (x-Achse) und die an der Schleuse Iffezheim erfassten Frachtmengen in Millionen Tonnen (y-Achse). Die Werte des verfügbaren Tiefgangs wurden aus den Wasserständen berechnet.2
Wenn der verfügbare Tiefgang unter eine bestimmte Schwelle fällt, werden die Schifffahrtsbedingungen zu einem Engpass für den Güterverkehr. Beispiele hierfür sind die Niedrigwasserperioden im Oktober und November 2018, aber auch die jüngere Periode Ende 2021 (siehe linker Teil von Abbildung 2). Bei Tiefgangswerten über einem bestimmten Schwellenwert zeigt das Streudiagramm keinen Zusammenhang, außer im rechten Teil des Diagramms, wo hohe Wasserstände den Güterverkehr tendenziell verringern.
ABBILDUNG 2: VERFÜGBARER TIEFGANG BEI KAUB UND GÜTERVERKEHR DURCH DIE SCHLEUSE IFFEZHEIM AM OBERRHEIN (MONATLICHE DATEN M1/2004-M12/2021)
Quelle: ZKR-Berechnung auf der Grundlage von Daten der Wasserstraßen- und Schifffahrtsverwaltung des Bundes (WSV), bereitgestellt von der Bundesanstalt für Gewässerkunde (BfG)
Für die Donau sind monatliche Daten für die Schleuse Wildungsmauer bei Wien verfügbar (Januar 2004 – November 2021). Diese Schleuse befindet sich im östlichen Teil Österreichs, wo der höchste Schiffsverkehr in der österreichischen Binnenschifffahrt zu verzeichnen ist. Im Streudiagramm ist ein gewisser Zusammenhang zwischen der Wasserführung und dem Güterverkehr zu erkennen. Wenn der verfügbare Tiefgang gering ist, scheint sich auch das Transportvolumen zu verringern.
ABBILDUNG 3: VERFÜGBARER TIEFGANG BEI WILDUNGSMAUER UND GÜTERVERKEHR AUF DER DONAU IN ÖSTERREICH (MONATLICHE DATEN M1/2004-M11/2021)
Quelle: ZKR-Analyse auf der Grundlage von Daten von viadonau und Statistik Austria
Auf der Donau war das vierte Quartal 2021 durch sehr niedrige Wasserstände und entsprechend verfügbare Tiefgangswerte gekennzeichnet. Die Ladungsverluste Ende 2021 können dadurch erklärt werden. Dies bestätigt die in Kapitel 1 gemachten Angaben.
Im ARA-Rhein-Handel folgen die Spotmarkt-Frachtraten für den Transport von Gasöl einem steigenden Trend, der im dritten Quartal 2021 beginnt und im November 2021 seinen Höhepunkt erreicht. Dies ist hauptsächlich auf die Niedrigwasserperioden im Oktober und November 2021 zurückzuführen.
ABBILDUNG 4: ENTWICKLUNG DER FRACHTRATEN FÜR GASÖL AUS DER ARA-REGION ZU ZIELORTEN AM RHEIN (INDEX 2015 = 100)*
Quelle: ZKR-Berechnung auf Grundlage von PJK International
* Die PJK erhebt Frachtraten (in Euro pro Tonne) für den ARA-Rhein-Handel mit flüssigem Massengut. Die ZKR rechnet diese Werte in einen Index mit Basisjahr 2015 um. Niederrhein: Duisburg, Köln. Oberrhein: Karlsruhe, Basel. Main: Frankfurt/M.
Das niederländische Statistikamt (Centraal Bureau voor de Statistiek, CBS) erhebt Frachtratendaten von einem Panel niederländischer Binnenschifffahrtsunternehmen. Diese Daten werden zweimal im Quartal erhoben und enthalten Treibstoff- und Niedrigwasserzuschläge.
ABBILDUNG 5: ENTWICKLUNG DER FRACHTRATEN PRO QUARTAL FÜR NIEDERLÄNDISCHE BINNENSCHIFFFAHRTSUNTERNEHMEN NACH MARKTSEGMENT (INDEX 2015 = 100, VIERTELJÄHRLICHE DATEN)
Quelle: Centraal Bureau voor de Statistiek (Binnenvaartdiensten; prijsindex)
Die Transportpreise für Trockengüter folgten ab dem dritten Quartal 2020 einem Aufwärtstrend. Die Frachtraten im Containerverkehr verzeichneten ab dem zweiten Quartal 2020 ebenfalls positive Zahlen. Bei Flüssiggütern blieben die Transportpreise auf einem niedrigen Niveau, wobei sie im dritten Quartal 2021 weiter sanken.
Die Transportnachfrage nach flüssigen Produkten stieg in den Niederlanden, nicht aber in den Nachbarländern. Dies erklärt die Situation bei den Frachtraten für Flüssiggüter für niederländische Binnenschifffahrtsunternehmen, da ihre Einsatzgebiete auch andere Länder umfassen.
ENTWICKLUNG DER TREIBSTOFFKOSTEN
Die Treibstoffkosten werden auf der Grundlage der vom Energiepreisüberwachungssystem des belgischen Wirtschaftsministeriums veröffentlichten Gasöl-/Dieselpreise analysiert.4 Ein Vergleich mit den Ölpreisen zeigt eine sehr enge Korrelation, die als Grundlage für einen Ausblick auf die Treibstoffpreise dient.
In der zweiten Hälfte des Jahres 2021 folgten die Ölpreise – und damit auch die Kraftstoffpreise – weiterhin einem steigenden Trend. Im vierten Quartal 2021 lagen sie bei 79,6 USD (ca. 69,8 Euro, da der Wechselkurs bei 1,17 USD/EUR lag).
ABBILDUNG 6: DURCHSCHNITTLICHE TREIBSTOFFPREISE NACH ANGABEN DES BELGISCHEN WIRTSCHAFTSMINISTERIUMS UND PREISE FÜR ROHÖL DER BRENT-ÖL-SORTE EINSCHLIEßLICH PROGNOSE*
Quellen: ITB und SPF Economie (Treibstoffpreis). US Energy Information Administration (Ölpreis). Federal Reserve Economic Data (historischer Wechselkurs US-Dollar/Euro). 1 Barrel (bbl) = 159 Liter.
* EIA = US Energy Information Administration. Die Prognose geht von einem nominalen Wechselkurs von 1,12 US-Dollar pro Euro in den Jahren 2022 und 2023 aus. Diese Prognosen berücksichtigen nicht die Auswirkungen des Krieges in der Ukraine.
In ihrem jüngsten kurzfristigen Ausblick vom Januar 2022 geht die US Energy Information Administration (EIA) davon aus, dass die Spotpreise für Rohöl der Sorte Brent im Jahr 2022 durchschnittlich bei rund 75 US-Dollar pro Barrel und im Jahr 2023 bei rund 67,5 US-Dollar pro Barrel liegen werden. Dies beruht auf Annahmen über die Pandemie und den wirtschaftlichen Aufschwung sowie auf OPEC-Vereinbarungen zur Drosselung der Fördermengen bis September 2022.56 Aufgrund der politischen Umstände überschritten sie Anfang März 2022 die Marke von 100 US-Dollar. Sollten sich die politischen Konflikte in der Ukraine fortsetzen, ist mit einem weiteren steilen Anstieg der Öl- und Energiepreise zu rechnen.
Die Brennstoffpreise in der europäischen Binnenschifffahrt werden sowohl von den Ölpreisen als auch vom Wechselkurs zwischen dem US-Dollar und dem Euro beeinflusst. Der enorme Anstieg der US-Staatsverschuldung begrenzt das Aufwertungspotenzial des US-Dollars gegenüber dem Euro im Jahr 2022.7 Die Abwertung des Euro gegenüber dem US-Dollar ab Mai 2021 von 1,22 auf 1,13 im Dezember 2021 führte zu einem Anstieg der Brennstoffpreise in der europäischen Binnenschifffahrt.8
Auf Grundlage dieser Überlegungen wird erwartet, dass die Brennstoffpreise in der Binnenschifffahrt im Jahr 2022 ihren Höchststand erreichen und im Jahr 2023 wieder sinken werden.
Trotz der Eindämmungsmaßnahmen im Zusammenhang mit der Pandemie zu Beginn des Jahres 2021 stieg die Beförderungsleistung (TKM) auf den Binnenwasserstraßen in der EU im ersten Halbjahr 2021 im Vergleich zum Vorjahreszeitraum um 4,3% (von 66.021 Mio. TKM auf 68.864 Mio. TKM). Die Niederlande und Deutschland, die beiden Länder mit dem höchsten Anteil an der Binnenschifffahrt in Europa, meldeten beide einen Anstieg der Verkehrsleistung um 5,5% (Niederlande) bzw. 4,7% (Deutschland).
Für den Rhein wird für die ersten drei Quartale 2021 im Vergleich zu 2020 ein Anstieg von 7,0% festgestellt. Diese positive Entwicklung ist insbesondere auf einen Anstieg der Transportnachfrage nach Kohle (+30%) und Eisenerz (+18%) zurückzuführen. Der Ausstieg aus der Kohle hat sich aufgrund der steigenden Gaspreise und der stark gestiegenen Nachfrage nach Kohle aus dem Energiesektor zeitlich verschoben. Während bei Trockengütern insgesamt ein Mengenzuwachs zu verzeichnen war, blieben die Flüssiggüter auf einem stabilen Niveau. Beim Containertransport ist für die Rheinstaaten ein Anstieg zu beobachten.
Der Passagierverkehr verzeichnete eine teilweise Erholung bei der Zahl der Flusskreuzfahrtschiffe, die bestimmte Schleusen passierten. Die Maximalkapazität der Schiffe wurde jedoch bei weitem nicht erreicht, dies stellt für die Rentabilität des Sektors eine echte Belastung dar.
Die Vorhersage der Ölpreise bleibt aufgrund der aktuellen geopolitischen Lage recht unsicher. Die Ölpreise haben Anfang März 2021 die 100-US-Dollar-Marke überschritten. Obwohl für 2022 ein Rückgang prognostiziert wird, besteht keine Gewissheit.
Ein eigenes Kapitel des Berichts ist der Schweiz gewidmet, wo Mineralölprodukte das größte Segment im Güterverkehr der Binnenschifffahrt darstellen. Der Modal Split-Anteil des Rheins an den schweizerischen Importen von Mineralölprodukten beträgt 24%, während Pipelines mit 36% im Jahr 2020 den höchsten Anteil haben.
Im Passagierverkehr der Binnenschifffahrt hat die Schweiz einen hohen Anteil. In diesem Sektor macht der finanzielle Umsatz der Schweizer Unternehmen 25,1% des gesamten Umsatzes aus, der in der EU und in der Schweiz erzielt wird. Schweizer Unternehmen sind in der Flusskreuzfahrt auf europäischen Flüssen, aber auch in der Tagesausflugsschifffahrt auf Schweizer Seen und auf dem Schweizer Teil des Rheins tätig.
1. GÜTER- UND PASSAGIERVERKEHR AUF BINNENWASSERSTRASSEN
• Die Verkehrsleistung der Binnenschifffahrt in der EU ist im ersten Halbjahr 2021 im Vergleich zum Vorjahreszeitraum um 4,3% gestiegen. Der Aufschwung wurde hauptsächlich durch den Trockengütersektor getragen.
• Der Passagierverkehr begann sich erst in der zweiten Jahreshälfte 2021 zu erholen. Die Zahl der Passagiere und damit die Auslastung der Kreuzfahrtschiffe blieb jedoch eher gering.
GÜTERVERKEHRSLEISTUNG IN EUROPA
VERKEHRSLEISTUNG DER BINNENSCHIFFFAHRT AUF DEM STAATSGEBIET DER EINZELNEN EUROPÄISCHEN LÄNDER – VERGLEICH ZWISCHEN DEM ERSTEN HALBJAHR 2020 UND DEM ERSTEN HALBJAHR 2021 (IN MILLIONEN TKM)*
Quellen: Eurostat [iww_go_qnave], OECD (Republik Moldau, Schweiz, Ukraine)
* Für das Vereinigte Königreich waren keine Daten verfügbar.
ABBILDUNG 1: VERKEHRSLEISTUNG DER BINNENSCHIFFFAHRT (IWT) IN EUROPA NACH REGION UND QUARTAL (IN MILLIONEN TKM)
Quellen: Eurostat [iww_go_qnave], OECD (Ukraine), Destatis (Rhein und Zuflüsse)
* Donau = TKM in allen Donaustaaten einschließlich der Ukraine
Die in Abbildung 1 dargestellte Verkehrsleistung zeigt einen stetigen Aufwärtstrend für die europäische Binnenschifffahrt, der im dritten Quartal 2020 einsetzt. Eine Abschwächung dieses Aufwärtstrends trat im dritten Quartal 2021 ein, was auf das Hochwasser im Rheingebiet zurückgeführt werden kann. Auf diesen Hochwasserzeitraum folgte eine Niedrigwasserperiode im vierten Quartal 2021.
RHEIN- UND DONAUSCHIFFFAHRT NACH GÜTERSEGMENT
ABBILDUNGEN 2 UND 3: VERKEHRSVOLUMEN AUF DEM RHEIN STROMAUF- UND -ABWÄRTS FÜR WICHTIGE GÜTERSEGMENTE (IN MILLIONEN TONNEN, FÜR DIE ERSTEN DREI QUARTALE DER JAHRE 2020 UND 2021)
Quelle: ZKR-Auswertung basierend auf Destatis
Der Güterverkehr auf dem traditionellen Rhein belief sich in den ersten neun Monaten des Jahres 2021 auf 126,4 Mio. Tonnen, gegenüber 118,1 Mio. Tonnen im gleichen Zeitraum des Vorjahres. Dies bedeutet einen Anstieg von 7,0%. Trockengüter und Containerverkehr verzeichneten höhere Mengen (+10,4% bzw. +3,7%), während der Flüssiggüterverkehr relativ stabil blieb. Der Kohletransport profitierte von den hohen Gaspreisen während des gesamten Jahres 2021. Insgesamt war die Nachfrage nach Schiffskapazitäten für Trockengüter in der zweiten Jahreshälfte 2021 recht hoch.
Für die Schleuse Iffezheim am Oberrhein lagen bereits Daten für das gesamte Jahr 2021 vor. Sie deuten ebenfalls auf einen Anstieg in den ersten neun Monaten hin (um 6,0%), der jedoch aufgrund von Niedrigwasser im vierten Quartal 2021 „abschmolz“. Für das gesamte Jahr 2021 blieb das Frachtaufkommen an dieser Schleuse stabil. Ein gegenüber dem Jahr 2020 stabiles Ergebnis ist damit auch für den gesamten traditionellen Rhein für 2021 zu erwarten.
ABBILDUNGEN 4 UND 5: VERKEHRSVOLUMEN AUF DER DONAU STROMAUF- UND -ABWÄRTS FÜR WICHTIGE GÜTERSEGMENTE (IN MILLIONEN TONNEN, FÜR DIE ERSTEN DREI QUARTALE DER JAHRE 2020 UND 2021)*
Quelle: Donaukommission – Marktbeobachtung
* Detaillierte Daten nach Gütersegmenten und Quartalen sind nur für die mittlere Donau bei Mohács verfügbar.
Auch auf der Donau profitierte der Eisenerztransport von der höheren Stahlproduktion. Der Anstieg in den ersten drei Quartalen 2021 im Vergleich zum gleichen Zeitraum 2020 beläuft sich auf 6,8%. Ein Blick auf die monatlichen Zahlen für Eisenerz zeigt jedoch, dass dieser Rohstoff im August und September 2021 aufgrund eines geringeren verfügbaren Tiefgangs der Schubverbände etwa 18-20% des Transportvolumens verlor.
Getreide folgt einer eher volatilen Transportnachfrage auf der Donau im Allgemeinen. Während die Getreidebeförderung im Jahr 2020 durch gute Ernten angekurbelt wurde, ging sie im Jahr 2021 zurück. Hierfür gibt es zwei Hauptgründe. Der erste Grund liegt in der Entwicklung auf dem europäischen Getreideexportmarkt. Ein zweiter Grund ist der Beginn der oben erwähnten Niedrigwasserperiode.
PASSAGIERVERKEHR IN EUROPA
Die Donau sowie der Rhein und seine Zuflüsse Mosel, Main, Neckar und Saar sind neben Seine, Rhône und Douro wichtige Einsatzgebiete für Flusskreuzfahrten in Europa. Allein die Donau machte im Jahr 2019, gemessen an der Zahl der Kreuzfahrtpassagiere, rund 40% des europäischen Marktes aus (ohne die Flüsse in Russland und der Ukraine). Zusammen mit dem Rhein und der Mosel, dem Main, dem Neckar und der Saar belief sich der Anteil auf etwa 80-85%.1
Ein statistischer Messpunkt für Kreuzfahrtschiffe auf dem Rhein ist die Schleuse Iffezheim am Oberrhein.
ABBILDUNG 6: ANZAHL DER FLUSSKREUZFAHRTSCHIFFE, DIE DIE SCHLEUSE IFFEZHEIM AM OBERRHEIN PRO HALBJAHR PASSIEREN
Quelle: Deutsche Wasserstraßen- und Schifffahrtsverwaltung
ABBILDUNG 7: ANZAHL DER FLUSSKREUZFAHRTSCHIFFE, DIE DIE SCHLEUSE IFFEZHEIM AM OBERRHEIN PRO MONAT PASSIEREN
Quelle: Deutsche Wasserstraßen- und Schifffahrtsverwaltung
Bei der Analyse der Monats- und Halbjahreszahlen für 2020 und 2021 zeigt sich, dass sich die anhaltende Erholung im Kreuzfahrtsektor ausschließlich auf den Zeitraum zwischen Juli und Oktober konzentriert. Die wichtige Frühjahrssaison konnte in den Jahren 2020 und 2021 keine Aktivität entfalten.
Für die Donau liegen Daten für die Schleuse Jochenstein bei Passau und die Schleuse Gabčikovo bei Bratislava vor. Letztere befindet sich an der Grenze zwischen der Slowakei und Ungarn. Außerdem liegt sie zwischen Wien und Budapest. Daher spiegeln die vorbeifahrenden Kreuzfahrtschiffe die Kreuzfahrtaktivität zwischen zwei wichtigen Zielen im europäischen Flusskreuzfahrtsektor wider. Neben Wien und Budapest ist auch Passau ein wichtiger Ort, an dem Kreuzfahrtschiffe ihre Reise beginnen und beenden.
ABBILDUNG 8: ANZAHL DER FLUSSKREUZFAHRTSCHIFFE, DIE DIE SCHLEUSE JOCHENSTEIN BEI PASSAU AUF DER OBEREN DONAU PRO MONAT PASSIEREN
Quelle: Deutsche Wasserstraßen-und Schifffahrtsverwaltung
Im Jahr 2019 passierten 3.668 Kreuzfahrtschiffe die Schleuse Jochenstein, mit insgesamt 512.458 Passagieren an Bord. Im Jahr 2020 waren es 324 Schiffspassagen und 25.160 Passagiere.
Im Jahr 2021 war mit 1.255 Kreuzfahrtschiffen und 107.727 Passagieren eine Erholung zu verzeichnen.
Die Daten für die Schleuse Gabčikovo zeigen für die ersten drei Quartale 2021 eine Erholung der Passagierzahlen im Vergleich zu 2020 um 77,4%. Allerdings liegt die Aktivität im Jahr 2021 immer noch 63,9% unter dem Niveau vor der Pandemie. Insgesamt wurden an diesem Grenzpunkt im Jahr 2021 (Q1+Q2+Q3) 98.000 Passagiere auf Kreuzfahrtschiffen gezählt, verglichen mit 55.000 in Jahr 2020 (Q1+Q2+Q3) und 568.000 Passagieren im Jahr 2019 (Q1+Q2+Q3). Im gesamten Jahr 2019 wurden in Gabčikovo 720.800 Passagiere gezählt.
TRANSPORTVOLUMEN IN DEN WICHTIGEN EUROPÄISCHEN BINNENSCHIFFFAHRTSLÄNDERN
ABBILDUNG 9: TRANSPORTVOLUMEN IN DEN WICHTIGEN EUROPÄISCHEN BINNENSCHIFFFAHRTSLÄNDERN (IN MILLIONEN TONNEN, VIERTELJÄHRLICHE DATEN ZUM TRANSPORTVOLUMEN AUF DEM GEBIET DES JEWEILIGEN STAATES)
Quelle: Eurostat [iww_go_qnave]
Aufgrund der mangelnden Plausibilität der Stat.Bel-Daten ab dem ersten Quartal 2018 wurden die Daten für Belgien ab diesem Quartal neu berechnet. Dazu wurde die Veränderungsrate angewendet, die in den plausibleren Daten der flämischen Wasserstraßenverwaltung (De Vlaamse Waterweg) enthalten ist. Die Reihe für Belgien folgt damit dem Trend für Flandern, ist aber auf einem höheren Niveau angesiedelt. Gegenüber früheren Ausgaben wurde beschlossen, Serbien hinzuzufügen, da die Binnenschifffahrt in diesem Land in jüngster Zeit stark gewachsen ist.
TROCKENGÜTER-, FLÜSSIGGÜTER- UND CONTAINERTRANSPORT IN DEN WICHTIGEN BINNENSCHIFFFAHRTSLÄNDERN UND -REGIONEN
ABBILDUNG 10: TROCKENGÜTERTRANSPORT (IN MILLIONEN TONNEN)
ABBILDUNG 11: FLÜSSIGGÜTERTRANSPORT (IN MILLIONEN TONNEN)
ABBILDUNG 12: CONTAINERTRANSPORT (IN MILLIONEN TONNEN)
Quellen: Eurostat [IWW_GO_QCNAVE], Destatis, Centraal Bureau voor de Statistiek, De Vlaamse Waterweg, SPW Service Public de Wallonie, Voies Navigables de France, Rumänisches Institut für Statistik
Hinweis: Für Belgien-Wallonien liegen keine unterjährlichen Containerstatistiken in Tonnen vor. Es wurde davon ausgegangen, dass die Produktgruppe „Maschinen/Sonstige Güter“ hauptsächlich aus dem Containerverkehr besteht. Die Daten enthalten die gesamte Binnenschifffahrt auf dem Gebiet des Landes/der Region.
1. SETTING THE SCENE – WHAT IS THE SITUATION TODAY?
Inland navigation is today at a crossroads, facing several influencing factors. These embrace water levels and hydraulicity issues, difficult macroeconomic conditions, i.e. slowdown in world trade, evolving sectoral, industrial and economic trends, the structural decline of carbon-related cargo and – most recently – the Covid-19 crisis. It is therefore essential to think about the development of new markets for inland waterway transport (IWT). This report will shed light on these opportunities, and on the drivers and barriers related to them.
A new market can be described as a branch where inland navigation is either not yet present or in an early stage of development and could be considered in the coming years as a suitable transport solution. However, existing markets also see innovative changes and are showing growth potential, for instance in light of energy transition and the sustainability pressure.
To develop this report, qualitative and quantitative research was carried out. Within the more quantitative part, desk research was used to analyse new markets for IWT that show growth potentials. This part entailed also the analysis of statistical data on the development of these new markets. Within the more qualitative part, interviews with relevant experts and actors from different sectors (logistics in general, IWT, ports, science and universities) were carried out, in order to gain further insight into the suitability of these new markets for IWT. This approach has led to the identification of three main pillars for IWT development.
These include urban logistics, new cargo flows triggered by energy transition (transport of alternative energies, e.g. biomass and biofuel, hydrogen, components such as wind turbines) as well as the circular economy and transport of waste. These three fields are interrelated and partly overlap. An example would be the transport of household waste in an urban agglomeration which would then be recycled to serve as a new energy which would again be transported on an inland vessel. This case would apply to all the three fields simultaneously.
Those three pillars show promising potential for IWT development. Another market that could be a growing segment in IWT in the future is the short distance container transport.1
For each of the three pillars, the report will present real-world examples or projects where inland waterway transport is already involved. In addition to that, some interesting research or pilot projects that test the integration of IWT in innovative urban waterway transport will be presented. It is worth noting that the projects presented in this report should not be considered as an exhaustive list. A more detailed annex with additional relevant projects is also available. The report will also highlight the barriers and drivers for the development of new markets in IWT.
EXISTING MARKETS FOR INLAND WATERWAY TRANSPORT – STATE OF PLAY2
Before embarking on an analysis of these identified pillars and related new markets, it is necessary to summarise the current state of the most relevant markets for IWT to understand where or where not to expect more growth. This endeavour will help to understand the need for new markets. The three main cargo segments in IWT embrace dry cargo, liquid cargo as well as container transport. In its present structure, IWT rather relies on traditional market segments. The future trend developments differ within the three main categories. Passenger transport (ferry transport, other public waterway transport, day trips, river cruises) is also an important component of IWT transport which, while having suffered greatly from the Covid-19 crisis, has seen positive demand trends in the past decades.
Overall, it is seen that the energy transition will have an important effect on freight volumes in inland navigation. This concerns coal in particular. Liquid mineral oil products will continue to be an important component of the energy sector and of inland navigation for the next decade, but a gradual decline is underway. For chemicals, the outlook is far more positive. Regarding foodstuffs, it is expected that a certain reduction of emission intensive livestock activities, combined with a change in consumer habits, will influence the transport of feedstuff. The more trade-related cargo segments (in particular container transport) will be influenced by structural slowdowns in world trade. A more detailed analysis per market segment is provided in this chapter.
DRY CARGO
The dry cargo segment accounts for 59.8% of IWT volume in EU-27 in 2020 and can be further sub-categorised into five segments:
Agricultural products
Agricultural and food products currently have a share of around 9% of goods transport on the Rhine and around 16% of goods transport on the Danube. Agricultural products show strong correlation with harvest results, a correlation that dominates the volumes transported each year. Bad harvest results lead to a decrease in volumes transported, good harvest results increase transport volumes. IWT seems to be a preferred mode of transport for long-distance transport of agricultural goods.
Feedstuff and food products
In western Europe, densely populated areas such as the Netherlands and Belgium are experiencing problems with high nitrogen emissions, due to intensive livestock activities. Political pressure to reduce these emisisons could lead to a reduction of these activities in western Europe. Additional influencing factors for this trend stem from a change in consumer habits towards less meat consumption. In the case of a reduction of livestock activities in western Europe, a shift of these activities to other parts of Europe (eastern Europe) or to overseas countries (South America) is likely.
In both cases, food products such as meat would then need to be imported, which would create transport activities. The case whereby these products are transported by inland vessels, however, is not very likely. The feedstuff needed for feeding cattle (livestock activities) would no longer be transported in the same volumes in western Europe, which would reduce transport demand, also on inland waterways. Therefore, the current trends in this sector point to a reduction of feedstuff transport in the future in western Europe.
A completely different market is the transport of food products in cities, which is beginning to develop, and which will be dealt with in this report as a new market in IWT, and illustrated by some successful projects (e.g. in Paris and Ghent).
Iron ore, steel and metals
Iron ore, steel and metals represent an important segment for inland navigation. For the Rhine their share accounts to 25% of total goods transported and for the Danube, the share reaches even around half of total goods transported.
For western Europe, the transport demand outlook for iron ore is not growth orientated, due to a high environmental pressure to reduce emission intensive steel manufacturing processes for which iron ore and coaking coal are needed as raw materials. Iron ore transport is also very vulnerable to macroeconomic fluctuations and a reduction of world trade, as steel production reaction is very sensitive to these factors. This was once again shown during the Covid-19 crisis.
Apart from these environmental and cyclical factors, iron ore and steel demand seem to be more saturated in western Europe than in eastern Europe. This last point is related to long-term economic catch-up mechanisms in eastern Europe. For the Danube region, these catch-up mechanisms contribute to a more growth-oriented outlook for steel and iron ore.3
Sand, stones, gravel and building materials
A main positive trend is captured in the segment of sands, stones, gravel and building materials, possibly more pronounced in western Europe than in eastern Europe. This consists in a growing activity in the housing market, in parallel with demographic growth. The last-mentioned factor divides western Europe, where demographic projections are positive (in particular in France, the Netherlands and Belgium) from eastern Europe, where they are more orientated towards stagnation or even a decrease.
For western Europe, a concentration on larger waterways (consolidation process) is likely to take place, in parallel with a concentration on larger production sites within the construction sector itself. In the coming years, in western Europe, large volumes of sand and gravel are expected to come on the market as a result of dredging and the great need of materials for dike reinforcement. Untapped potentials lie in the urban inland waterway transport and transport of construction materials to construction sites. This urban transport of building materials is one example of a new market in IWT. Therefore, this market segment comprises both traditional long-distance transport as well as new urban short-distance transport.
Coal
Coal faces an almost complete phase- out in western Europe, as far as steam coal (hard coal used in the energy sector) is concerned. The reason is the energy transition in the major IWT countries in western Europe. Indeed, among other measures, with the exit from coal, governments aim to reach the goals of the Paris Agreement of the United Nations, adopted by 196 parties on 12 December 2015 and which entered into force on 4 November 2016.4 In Germany, for instance, the government decided on a gradual exit from hard coal until 2035 and lignite until 2038.5 For coal transport in IWT, only hard coal is relevant as lignite is not transported on inland waterways.
Figure 1 shows the decrease in coal transport in the EU-27 that started in 2015. Around 90% of the series ‘Coal and lignite, crude petroleum and natural gas’ concerns hard coal, as neither lignite, nor crude petroleum or natural gas are transported on inland waterways in large quantities. And within this amount of hard coal barge transport in the EU (27.4 million tonnes in 2019), 84.8% was transported on German inland waterways (23.3 million tonnes). One could also mention that coal transport by inland vessel is even higher in the Netherlands (25.3 million tonnes in 2019) than in Germany, but these similarly high numbers reflect the fact that coal is transported from the Amsterdam-Rotterdam-Antwerp (ARA) seaports in the Netherlands to Germany, for providing coal fired power plants and the steel industry with raw materials.
The amount of 27.4 million tonnes of hard coal barge transport in the EU does not contain coking coal or coke (2.5 million tonnes in 2019). The entire coal volume on EU inland waterways is therefore around 30 million tonnes per year. The coal transport by inland vessels in Germany represents around 84% of total coal transport by inland vessels in the EU.
FIGURE 1: TRANSPORT OF FOSSIL FUELS BY IWW IN THE EU 27 BETWEEN 2008-2020 (MILLION TONNES)
Source: Eurostat [iww_go_atygo]
However, hard coal is at the beginning of a phasing-out process in the energy sector in Germany. Figure 2 shows the planned reduction of power plant capacities for hard coal (in GigaWatt) in Germany. The first power plants were taken off the grid in 2020, and already by the end of 2024, the original power plant capacities will have been halved. Based on this series, a complete phase-out of steam coal transport on German inland waterways can be expected by 2036.
Steam coal is the type of coal used in the energy sector, while coking coal or coke is the type of coal used in the steel industry. Based on the Eurostat data, the large majority of hard coal transport in the EU would be steam coal (27.4 million tonnes), and only a small fraction would be coking coal (2.5 million tonnes). However, evidence about the use of coal in Germany points to a much higher share of coal used for steel manufacturing (according to coal import statistics, coal used for steel production accounts for at least 50% in Germany). The classification within the Eurostat NST 2007 system might not reflect this pattern entirely.
FIGURE 2: REDUCTION OF POWER PLANT CAPACITIES FOR HARD COAL IN GERMANY (GIGAWATT)
Source: Bundesministerium für Umwelt, Naturschutz und nukleare Sicherheit
At present, the Danube area is less affected by the energy transition, as it is progressing at a slower pace in this region. However, it is expected that all IWT regions will be impacted by the energy transition developments in the near future.
The series ‘Coke and refined petroleum products’ will be discussed in the next part on liquid cargo. It has to be clarified that this NST 2007 group contains mainly refined petroleum products (share of 97%), while coking coal is represented only marginally in this series with 3%.
Liquid cargo (chemicals and petroleum products)
Volumes of liquid cargo account for 28.1% of the IWW transport volume in EU-27. A main distinction must be made between chemicals and refined petroleum products. On the Rhine, the share of petroleum products is very high with 17.3% of total cargo transport in 2020, and 27.6 million tonnes in absolute numbers, forming the largest cargo segment on this most important inland waterway in Europe. Petroleum products are also very important for IWT volumes in Belgium and the Netherlands.
Although petroleum products such as gasoil/diesel, gasoline and kerosine are still expected to be part of a propulsion mix in the next decade, there are no growth prospects, and a gradual decline is assumed, possibly reaching near zero by 2050. Indeed, the long-term vision of “a zero GHG emissions inland navigation sector by 2050” is a shared political goal at various levels.6 Electrification of the transport sector, which makes petroleum products gradually redundant, acts as another influencing factor that puts pressure on liquid cargo volumes in IWT.
For chemicals, a far more growth-oriented development is expected. IWT is the preferred mode of transport in the chemical industry, and chemical production itself has overall more growth prospects in Europe than mineral oil production.
Petroleum products have lost some transport performance in recent years (mainly due to low waters and the Covid-19 crisis), but there was no real downward trend so far in this segment (see figure 1, series ‘Coke and refined petroleum products’). However, a significant drop in this segment would prevail in the case of a major electrification of road transport. The reason is that liquid fossil fuels used in the road transport sector, together with heating oil, form the backbone of the petroleum products transport in IWT.
Electrification of the European transport sector is still in an early phase, allowing the IWT sector to adapt and explore new market opportunities. For instance, in 2019, the share of electric cars within the total number of new registered cars was 1.6% in Germany, 1.0% in France, 0.8% in Belgium, 11.4% in the Netherlands and 2.1% in Switzerland.7 For Germany, national figures for 2020 (for other countries, Eurostat figures were not yet available for 2020) point to a strong increase of this share up to 6.6%.8
According to these national data, a major absolute increase of newly registered electric cars can be observed in Germany in 2020 (194,163 units) representing a major uptake compared to 2019 (63,281 units). However, this number is very low compared to the stock of cars (47.716 million units in 2020) in this country, of which the vast majority is still propelled by liquid fossil fuels.
Also in Europe overall, new registrations of electric cars have shown strong increases both in absolute and relative terms. According to the European Alternative Fuels Observatory (eafo), new registrations of electric cars in 2021 amounted to 16% of all newly registered cars, whereas the value for 2020 was far below at only 10.5% and 3.0% in 2019.9
Altogether, the very recent uptake in electric cars registration can explain why liquid petroleum products has not experienced any clear structural downward trend within inland waterway transport to date. However, electrification of the transport sector is currently gaining momentum, also underlined by a further rise in the share of new electric cars in the first seven months of 2021 (reaching 10.7% of all new registered cars) in Germany.10 The trend in Germany is of high relevance, as the Rhine market represents – together with the ARA region market – the core region of the liquid cargo transport in Europe.
Container
Container transport accounts for 12.1% of IWW transport volumes in the EU-27. Already before the Covid pandemic in 2020, the world trade of goods slowed down, and this trend is expected to continue. The importance of global trade in goods is decreasing in trend terms, while trade in services is increasing. This structural change in trade can be explained by the following factors:11
1) Shift of consumer demand away from tradeable goods to services in developed countries (dematerialisation).
2) Growing incomes and wages in emerging market countries leading to less wage and cost differentials worldwide, and therefore to less incentives for worldwide trade of goods.
3) Technical innovations such as 3-D printers reducing trade in goods further.
Further reasons taken from van Dorsser et al (2018)12 for the structural change in container throughput are:
4) Declining population growth in Western Europe.
5) The fraction Labour/ Population, i.e. the share of population contributing to economic output is decreasing, not only due to ageing populations but also due to the retirement of the baby boom generation. In addition to that, job losses linked to artificial intelligence put approximately 40-50% of jobs at risk.
6) The growth rate of the fraction GDP/Labour decreases, which reflects a decreasing productivity growth, resulting from lower economies of scale in innovations. This trend affects technology frontier countries.
7) Reverse globalisation (decreasing ratio Trade/GDP), i.e. a higher focus on local production.
8) Containerisation coming to its saturation limits.
These tendencies would create more regional logistic and production chains and would certainly have negative effects on seaborne container transport, as around 90% of world trade in goods is carried out by seaborne trade. Furthermore, these trends would affect seaport hinterland container transport on inland waterways. This is because inland waterway container transport is strongly linked to maritime container transport. However, if container transport would be able to integrate more in regional and urban logistics chains, and if it would be possible to build up short-distance container transport, it would keep a higher growth rate overall.
PASSENGER TRANSPORT
Passenger transport demand can be split into touristic activities and public transport activities. The latter also includes the traditional ferries, crossing waterways transversely in the form of floating bridges. This characteristic plays a crucial role in urban mobility. During the pandemic, the touristic passenger transport came to a complete halt. The relaxation of sanitary measures is expected to lead to a slow recovery in this market. It might take some years before the demand reaches its pre-crisis level.
Passenger transport in the form of public transport services, including ferries, on urban waterways can be considered as an important tool for making cities greener and more sustainable. The fact that urban passenger transport on waterways can be carried out by electric propulsion, given the limited distances in cities, is one major reason for its potential for making cities more environmentally friendly. At the same time, waterway transport reduces the overutilisation of roads and related negative effects (accidents, traffic jams in cities). Passenger transport in cities in the form of public transportation systems has huge potential, as the example of the waterbus in Brussels shows. The present report will focus only on public passenger transport in cities, not on touristic transport.
UNTAPPED POTENTIAL FOR INLAND WATERWAY TRANSPORT – MAIN DRIVERS
The following chapter will analyse the main trends that are expected to act as driving forces for urban mobility. As will be seen, the characteristics of inland navigation make it suitable as an alternative transport solution in urban areas in light of the current challenges that urban environments are facing. New markets in inland navigation can therefore emerge in light of climate policies favouring the decarbonisation of societies and insisting on more sustainable, resilient and future proof transport modes. IWT could therefore play a crucial role for making societies, in particular cities, more sustainable from an environmental and social point of view, resulting in new market opportunities. The social point of view refers to a reduction of accidents and noise by a modal shift from road to IWT, and a reduction of related negative externalities.
SATURATION OF EXISTING TRANSPORT INFRASTRUCTURE IN CITIES
Nowadays, large agglomerations are facing important challenges at the demographic, economic and environmental levels. Currently, more than half of the world population lives in urban areas and this share will increase further in the future. The World Urbanisation Prospects of the United Nations Department of Economic and Social Affairs (see figure 3) projects that this percentage will increase to 68% by 2050. In the EU, urbanisation rates are among the highest in the world. Around 74% of the EU population already lives in urban areas. The share of urban population reaches for instance 98% in Belgium and 91% in the Netherlands, both countries being important for European IWT. Other relevant IWT countries such as France, Germany and Romania are projected to see a steady decrease in their rural population by 2050.
FIGURE 3: SHARE OF URBAN AND RURAL POPULATIONS IN EUROPE BETWEEN 1950 AND 2050 (% OF TOTAL POPULATION)
Source: World urbanisation prospects – United Nations, Department of Economic and Social Affairs, Population Division (2018)
The demand for goods, of which cities are net importers, rises with the size of urban population. In parallel, the production of waste increases and solutions to remove such waste must be found. This also leads to an increase in the demand for transport infrastructure. For this reason, the EU is dedicated to promoting sustainable urban transport systems. Traffic congestion in cities is the cause of substantial economic loss, estimated to account for EUR 180 billion per year in terms of delay costs and about EUR 32 billion per year in terms of deadweight loss at EU-27 level.13 According to the Staff Working Document of the Smart and Sustainable Mobility Strategy, ‚[t]he delay cost gives a value of the travel time lost relative to a free-flow situation. The deadweight loss costs is the part of the delay costs which is regarded as a proper basis for transport pricing.‘
Current transport systems are mainly based on fossil fuels and are therefore not sustainable in the long run, given the related negative externalities, scarcity of resources and energy dependence of the EU.14 Road transport is by far the dominant mode of transport and represents 76.3% of total inland freight transport (excluding pipelines) in the European Union, compared to 17.6% for rail transport and 6.1% for inland waterway transport. In some countries, IWT has a higher modal share than rail transport, such as in the Netherlands and in Belgium.
Changing habits among consumers places another strain on urban logistics. The rise of e-commerce and the necessity of ever faster and personalised deliveries incentivise the fragmentation of deliveries, leading to 23% of vehicles on the road travelling unloaded, according to a case study conducted in Austria.15 The increase in the number of vehicles is also linked to the phenomenon of logistics sprawl, whereby, due to high land costs in the urban perimeter, logistics operators prefer to move their sorting centres further and further away from the centre. These elements put additional pressure on environmental indicators in large agglomerations, as they lead to even more road transport.16 Innovative solutions for urban freight delivery are called for to avoid the negative impacts that this framework would cause either to the economy and to the environment.
Cities located near and around waterways could take advantage of their location to make deliveries of goods in specific sectors more efficient and less polluting, through an increased use of IWT solutions. Moreover, due to historical reasons, inland waterways are often located in the heart of city centres. This feature makes them a natural infrastructure suited to deliver transport services of different types (goods for shops, restaurants, hotel and accommodation, etc.) in areas that are more and more precluded to road transport.
Contrary to road freight, IWT is an unsaturated mode of transport, as it uses transport infrastructure with free capacities, and a safer mode of transport. The lack of congestion facilitates on-time deliveries and the overall efficiency of urban transport flows, while generating fewer accidents and fatalities and consequently reducing the related negative external costs (health treatment costs, societal costs due to fatalities).
GREENHOUSE GAS AND POLLUTANT EMISSIONS OVERALL AND IN SELECTED CITIES
The transport and storage sector (NACE H) is responsible for approximately 15% of total greenhouse gas emissions in the EU and has not seen a significant decline in this respect as other polluting sectors, as shown in Figures 4 and 5.17
FIGURE 4: GREENHOUSE GAS EMISSIONS – DEVELOPMENT AS INDEX IN THE EU-27 (INDEX 2008 = 100)
Source: CCNR elaboration based on Eurostat data [env_ac_ainah_r2]
FIGURE 5: ABSOLUTE DEVELOPMENT AND STRUCTURE OF GREENHOUSE GAS EMISSIONS IN THE EU-27
Source: CCNR elaboration on Eurostat data [env_ac_ainah_r2]
Alongside GHG emissions, air pollutant emissions are also very problematic. The very small particles, known as PM10, common air pollutants, are inhalable and can cause health problems. For this reason, the EU sets the limit that PM10 emissions in cities must not exceed 50 µg/m3(daily average concentration) on more than 35 days per year. Figure 6 shows the 36th highest PM10 emission value per year as average of a constant panel of air quality stations in each city18 for Amsterdam, Berlin and Brussels.19
In order to respect the threshold or emission limits set by the EU, the values in figure 6 should not be higher than 50 µg/m3. The values are almost always below this threshold. However, for Amsterdam and Berlin, the emission trend between 2016 and 2018 was slightly upward orientated. Figure 6 shows also that Berlin exceeded the emission limit in 2014.
FIGURE 6: YEARLY DATA FOR THE 36TH HIGHEST PM10 EMISSION VALUE FOR PARTICULATE MATTER (< 10 µM) IN SELECTED EUROPEAN CITIES BETWEEN 2012 AND 2018 (µG/M3)
Source: European Environment Agency and CCNR analysis, average air pollutant concentrations for a panel of air quality measurement stations in each city
The PM10 data for Paris were not complete (missing values for certain measurement stations in certain years) and could not be shown on a representative basis.
NO2 is another important pollutant, affecting health and air quality in cities. Figure 7 shows the annual average concentrations of nitrogen dioxide (NO2) measured at the level of a panel of air quality stations in Amsterdam, Berlin, Brussels and Paris. In Paris, the average concentration of nitrogen dioxide was constantly above the limit set by the EU, which states that the annual mean concentration of NO2 should not exceed 40 µg/m3 on more than 35 days per year. Values near the emission limit are also observed for Berlin and Brussels.
FIGURE 7: YEARLY DATA FOR THE 36TH HIGHEST EMISSION VALUE FOR NITROGEN DIOXIDE IN SELECTED EUROPEAN CITIES BETWEEN 2012 AND 2018 (µG/M3)
Source: European Environment Agency and CCNR analysis, average air pollutant concentrations for a panel of air quality measurement stations in each city
As would be expected, emission data collected by the European Environment Agency show that PM10 and NO2 levels tend to be much lower in rural areas, and on the outskirts of cities. This provides an incentive to focus efforts on reducing emissions in urban areas. Inland waterway transport – in the form of electrified urban water transport or using other clean propulsion methods – could help to reduce these emissions. The further use of low-emission vessels would be a positive contribution for enhancing air quality and reducing congestion in cities. The combination of both factors could result in growing market opportunities for IWT.
RISING PRESSURE TO IMPROVE THE SUSTAINABILITY OF OUR ECONOMIES
Addressing climate change is a political priority for institutions at all levels (international, national, and local). Public policies aiming at an emission-free economy often highlight the relevance of sustainable transport solutions. Inland navigation should play a relevant role in this transition process. The European Green Deal (EGD) 2019 calls for 75% of inland freight transport to shift from road to rail and inland waterways. Main European cities are restricting access to specific areas for heavy-duty vehicles through low-emission zones. Public policies related to the energy transition are fundamental levers for the market development of IWT. While the energy transition of the IWT sector itself is out of the scope of this report, there is no doubt that the ‚greening‘ of IWT could strengthen its position as a sustainable mode of transport – both from an environmental and an economic point of view.
New markets in inland navigation become essential in the framework of a transition towards a more sustainable transport sector and a climate neutral Europe. Inland navigation in the 21st century also faces several bottlenecks, including those that are structural, both on the demand and supply sides.
On the demand side, the outlook for several goods segments points to saturation or even decline (e.g. coal). A likely structural slowdown in world trade is another important challenge for inland waterway transport. While the energy transition changes the product portfolio of inland navigation, it is also expected to lead to the emergence of new markets, to which the inland navigation sector will need to adapt in order to gain market shares.
On the supply side, inland vessels will be confronted more and more with difficult navigation conditions on free-flowing rivers such as the Rhine, Danube, Elbe, and others. The underlying reason is low water periods which are expected to intensify with the ongoing climate change. The low water phenomenon and its related negative effects (loss of transport volume and of modal shares for IWT) calls for a diversification of the areas of operation of inland vessels, towards a higher participation in city or urban logistics, for instance, where water levels are less critical.
For these reasons, it is important to identify and anticipate the emergence of new markets in inland waterway transport (IWT). New markets can determine new types of products transported by inland vessels, but they often imply new types of logistics, new types of vessels and new areas of operation.
For example, one important new market, urban inland waterway transport, does not only imply a change in the type of cargo transported (e.g. parcels instead of mass cargo), but also a change in the areas of operation (city logistics instead of transport crossing borders), a different range of logistics (short-distance instead of long-distance transport), and different types of vessels (smaller vessels instead of large vessels).
Based on statistical data, literature research and expert interviews, the following new markets for IWT have been identified:
1) Urban passenger transport by inland vessels in the form of public local transport (examples are found in Antwerp, Brussels and Rotterdam).
2) Urban freight transport by inland vessels (construction material, food products, parcels, etc.) in large cities such as Amsterdam, London, Paris, Lyon.
3) New cargo flows stimulated by circular economy strategies (e.g. waste transport).
4) Transport of renewable energies or components for their generation (biomass, biofuel, hydrogen, wind turbines).
The detailed analysis of these topics reveals one common feature: new markets for IWT exist, and with high potentials. However, these markets are not yet sufficiently developed to gain easy access to the inland navigation sector. They are fraught with intermodal competition, commercial, logistical and technological challenges, risks and uncertainties to varying degrees.
The urban transport of freight, passengers and waste is an activity where inland navigation meets the need of society and governments to find solutions for existing and growing urban problems, in terms of saturation of road infrastructure, related negative externalities, and ecological problems in cities.
Similarly, the transport of alternative energies meets the need of our society to transform the energy sector from a fossil to a non-fossil form of energy generation. It is found that this new market, despite having certain potentials, is strongly dependent upon political and regulatory activities. Together with the partly unknown technological and economic trajectories of different renewable energies, these features represent certain risks for the development of this sector as a new market for IWT.
However, urban waterway logistics also face hurdles and risks. One significant hurdle is the competition for space in urban areas between the transport or logistics sector on the one hand, and the important housing and tourism sectors, on the other hand.
All in all, many transformations need to be accomplished to extend the cargo portfolio of inland navigation. The report sheds light on these necessary transformations and challenges and describes key projects in different new markets and in different cities, countries and regions, where these transformation processes are already underway and where first success stories can be told.
2. INLAND WATERWAY TRANSPORT EMBEDDED IN URBAN LOGISTICS
In cities situated close to waterways, inland navigation is considered increasingly in logistic supply chains. Urban logistics embraces a broad field of freight distribution comprising various interactions such as Business to Business (B2B) or Business to Customer (B2C) and the passenger transport system within urban areas.20 Sustainable urban logistics should enable the flow of goods that enter, leave and circulate in the cities to be transported in the most environmentally friendly and sustainable way.
IWT in urban logistics has found more interest in the last decade, thanks to initiatives for more sustainable urban logistics coming from the public side (cities), and from companies active in the retail or construction sector with logistical activities in cities. However, it is still far below its reasonable potential.21 This report will give an insight into both already operational projects and pilot or research projects. It distinguishes between urban passenger transport and urban freight transport.
URBAN PASSENGER TRANSPORT USING WATERWAYS
Urban passenger transport using waterways can be divided into public transport services for commuter traffic and touristic transport. There is of course a certain overlap between these two categories. Within this report, the focus will be on public transport services. For touristic transport a number of examples in cities (e.g. Amsterdam, Paris, Hamburg, etc.) exist, but this is not a new market. However, public transport by inland vessel in large agglomerations is an activity that, although not entirely new, was largely abandoned over a long time. This is the reason why it is integrated in this report as a new market.
The canal shuttle Waterbus navigates between Brussels and Vilvoorde, an approximate distance of 10 kilometres on the Zenne canal. It brings commuters, other passengers and tourists on a daily basis from remote locations to the city centre of Brussels. In only less than an hour, with a speed of 12-14 km/h on average,23 the shuttle travels from Vilvoorde Centrum, Park Dire Fonteinen, Cruise Terminal, Quai de Heembeek, Pont van Braet, Quai de Peniches, all the way to Sainctelette. The stops accessed via other public transport modes or by car have free parking places.
Waterbus illustrates an extension of the public transportation system in Brussels allowing to reach out to remote areas and interconnecting the city to a better extent. Sub centres are emerging in the different areas to attract citizens. Through Waterbus, incentives to develop sub centres are reinforced.
Launched in 2013, the Waterbus project proved its economic viability and its role as a solution to urbanisation challenges such as emissions and high road congestion and related long travel hours. It transports on average 40,000 passengers per year.24
A similar project has been implemented in Antwerp known as ‚DeWaterbus‘ connecting Antwerp to Lillo and Hemiksem.25 In the Netherlands, a waterbus project has also been implemented connecting the city of Rotterdam better via the waterways.26
Source: CCNR based on waterbus.eu/en-us and Open Street Map data
The Roboat project aims to develop autonomous sailing on waterways. Roboat is a concept born from the collaboration between the Massachusetts Institute of Technology (MIT) and the Amsterdam Institute of Advanced Metropolitan Solutions (AMS). Besides the main partners, Roboat also enjoys the support of the municipality of Amsterdam, Waternet, Torqeedo, Vetus and Murata.
Roboat aims to make use of the existing infrastructure provided by the canals of Amsterdam and is open both for freight and passenger transport. The floating platforms using self-driving technology are in fact versatile, which is a quite unique characteristic. They can be used to transport persons, collect waste, deliver goods, combine to form bridges and performance stages. According to the project’s official website, the use of Roboats as floating dumpsters carrying away waste could serve 70% of the city centre’s needs in terms of waste collection. The project is currently still in a pilot phase. With a duration of five years, the partners began testing the first small scale prototypes in 2017. In the following years, research continued and in 2020, the full-scale prototypes were developed.
Concepts such as that of Roboat have the potential to improve passenger and freight transport in cities that are deeply interconnected with inland waterways, especially since it has touched a niche in the city logistics of Amsterdam. However, regulatory obstacles hamper the full implementation. Roboat’s advantage is that its headquarters are located directly on the Amsterdam waterway, allowing them to perform real testing of the vessel on their own ‚private‘ waters to allow a better and real testing of the vessel. In general, for autonomous sailing, a boatmaster needs to be on the vessel to be allowed on public waterways.
Roboat does not consider freight transport yet, as the necessity of human interaction in this field entails increased labour costs. So far, two business cases have been assessed. The Roboat for passenger transport as a taxi carrying up to five passengers and the second relates to waste collection. Both projects show increased potential. Roboat in future could also be used as an infrastructure component of a passenger bridge for example, in congested areas.
Source: Adobe Stock, Castel Sant’Angelo and Ponte Sant’Angelo – bridge over the Tiber River, Rome, Italy
The city of Rome has shown interest in using the Tiber as a passenger transport infrastructure.
This further proves that IWW transport methods are attractive for their unexpressed potential in cities where they are far less developed. Tiber Cat is a project, yet to be implemented, on which architects Paolo Carlodalatri and Fabrizio Vinditti are working. Tiber Cat involves building a fully electric catamaran capable of carrying up to 50 passengers. It would be able to navigate with a water level of one metre, and would complement the existing public transport network, differentiating itself from existing tourist boats.
The idea is part of plan of the Italian Ministry of Infrastructure and Transport, in collaboration with the city of Rome, to redevelop the area of the Tiber to make it navigable over a 60 km stretch. The use of the catamaran would be the first step towards this long-term goal, allowing navigation on the most navigable stretches of the river (from Prima Porta to Isola Tiberina, a distance of about 10 km). This initial choice would avert the challenge posed by the rapids that characterise the Tiber, improving the chances of success. Constant support from the administration represents the necessary condition for the project to get off the ground.
Project of the catamaran, source: Professor Paolo Carlodalatri
URBAN FREIGHT TRANSPORT USING WATERWAYS
Inland navigation allows for many different types of cargo to be transported in city centres (parcels, food products, cardboard, construction material etc.) and in varying forms (pallets, bulk, barrels, containers and so on). This is demonstrated by the large number of projects (non-exhaustive) presented in this section. For each project, it is specified whether the project is already implemented or whether it is still in the pilot stage (on its path to implementation/ showing potential for sustainable urban logistics solutions).
URBAN PARCEL DELIVERY
Multimodal parcel delivery in urban areas has rooted on fruitful ground. Projects operating in various cities provide an insight into sustainable transport methods addressing urbanisation challenges.
Holland’s Glorie – DHL in Amsterdam – implemented project29
In Amsterdam, Holland’s Glorie, a retired passenger ferry, found its passengers replaced by parcels. Since 2017 Holland’s Glorie has been operating using three modes of transport, inter alia electric trucks, a vessel and cargo bikes to bring parcels to the city centre of Amsterdam.
Source: DHL
FIGURE 1: MULTIMODAL PARCEL DELIVERY IN URBAN AREAS
The ferry navigates twice a day from its base towards the city centre. Figure 1 captures the different steps of the delivery process. Parcels arrive at Schiphol airport and are loaded onto electric trucks which then transport the parcels to the vessel. Once in the vessel, the journey begins on Amsterdam’s waterways, to reach a platform in the city centre (Koningsplein) where cargo bicycles await the parcels to be delivered. In total there are 21 bicycle messengers.
The advantages of delivering by bike lie in the efficiency of deliveries by hour. One can reach up to 17 deliveries per hour, whereas by car it amounts to 5 or 6 deliveries. The reasons for this are set in the narrow streets of Amsterdam’s city centre, where traffic, many bikes, motor bikes and almost no available parking places slow down the delivery process.
Another promising and operational example of successful parcel delivery using waterways is Urban Logistic Solutions (ULS) in Strasbourg. With a rental vessel from VNF, parcels are transported from the north area of the Port of Strasbourg (Quai du Bassin des Remparts, where the warehouse is situated) to a platform located in the city centre (Quai des Pêcheurs),31 a distance of approximately five kilometres. The parcels are packed into container-like boxes, and are thereby protected from all kinds of weather conditions and from being lost.
Once arrived in the city centre, 15 available cargo bikes deliver the parcels to the final recipient in the city centre area. For the time being the vessel carries out one rotation per day but shows increasing potential in the near future. In fact, plans to invest in a larger vessel running on alternative fuel are under preparation.
A mobile crane on the platform helps transfer the loads from the vessel onto the cargo bikes. According to Thomas Castan, Director of ULS Strasbourg, cranes on the berths handle goods more efficiently and allows a better quality of transport service. In addition, an integrated crane on the boat would come with additional maintenance costs.
As well as parcel delivery, ULS transports different kinds of goods and recycles used cardboard boxes on its vessel. The capacity of the vessel amounts to 680 palettes which amount to 180 kg each. It yields a total capacity of 122 tonnes and has a width of 3.06 metres.
Source: Le Monde /Frederick Florin
In addition to the environmental and efficiency reasons fostering the use of IWT in this segment, the market of parcel delivery is also booming due to increasing online trading. Hence there is potential to expand, especially as regards last mile deliveries and usage of inland waterways. During the interview, the impact of public policy actions was also highlighted. For instance, possible changes in the access routes or possible access restrictions for trucks to the city centre could encourage some economic actors into looking for alternative transport modes, including IWT.
Created in 2016, Fludis is a new player in urban logistics. As it is fully electric, it provides competitive and decarbonised solutions for major players in transport, logistics and trade, handling the overall provision of the first and last kilometre. The aim is to avoid costly stock-outs in the warehouse. The company employs 11 people, including eight cyclists.
Fludis operates as follows: a semi-trailer truck transports the goods directly to the boat and the bikes deliver to the final customer:
– for the outbound journey, Fludis delivers for the company Lyreco in several districts of Paris every day;
– for the return journey, it collects electronic waste from Paprec.
The boat makes several stops in Paris depending on the delivery addresses. Each day, approximately 700 kg of goods are delivered. The sailing time is valued by working onboard (preparation of the packages on board: breaking down the pallets and reconstituting the loads).
Despite the advantageous position of the Seine, outstanding issues remain which could impact the viability of the project. The berths available for urban logistics in Paris are multi-purpose berths and can be used for 15 minutes only. However, this is not adapted to the specific demands of urban river logistics, as Fludis deliveries require a two-hour stay at the berth to accomplish the different deliveries. To make this possible, an adaptation of the current contractual model with Haropa, the port company managing the infrastructures of the Port of Paris, would be needed.
Fludis has to pay high dock dues compared to trucks which can circulate in Paris freely without having to pay any kind of tax. This affects its competitive position compared to other transport modes. Eventually, political and economic decision-making should have an impact on the development of urban river logistics, whether negatively (i.e. limited use of berths for transshipment operations) or positively (setting up of incentives for the use of IWT solutions in urban areas).
In the historic city centre of Utrecht, the damage done by heavy duty vehicles is an ongoing concern. In 1996, the waterways came into spotlight for the delivery of various goods to the city center, more specifically to establishments located near the canals of Utrecht.
The municipality of Utrecht introduced a more innovative and economically viable way of freight transport using the waterways, the B2B beer boat. This concept is considered as an efficient last mile operation for the delivery of beer from four breweries and food products from one catering company to 65 bars and other establishments in Utrecht. It should be noted that this project benefitted from government subsidies.
By 2010, the beer boat was updated to a zero-emission electric boat thus addressing the further urbanisation issue of high emissions. Given its economic viability in the transport of food products and beverages, another electric zero emission vessel was introduced in 2012 transporting also other goods segments such as waste. The loading capacity of the electric beer boat, which is 18 metres in length and two metres in width, amounts to 18 tonnes of cargo or an equivalent of 40-48 containers.
Source: City of Utrecht
Overall, the concept has successfully contributed to a better air quality, noise reduction, less road occupancy and less road congestion. It has made accessibility to the city centers easier and more comfortable.34 According to a beer boat fact sheet, the boat has contributed to a yearly reduction of emissions of 17 tonnes of CO2, NOx by 35 kg and PM10 by 2kg.
This urban distribution concept was launched in September 2012 and is based on a multimodal chain combining river and road transport. It is the result of a partnership between XPO Logistics (transport and organisation of the chain), Haropa Ports de Paris (port infrastructure), SCAT (river transport) and Terminaux de Seine (handling). It received the support of Voies Navigables de France and the Ile-de-France region.
In two Franprix warehouses, approximately 20 km south of the Paris city centre, 50 containers filled with grocery goods are loaded onto inland vessels each day. The convoy leaves the warehouses at the end of the day in order to pass through two locks on the Marne before 8.30 pm. It arrives in the evening at the Port of La Bourdonnais, at the foot of the Eiffel Tower, and stays there until 5.30 am, when the first handling operations begin. The containers are then transported by truck in order to be delivered to 300 Parisian shops.
According to Franprix, the system saves 450,000 kilometres of travel by road per year, the equivalent of almost 13,000 laps of the Paris ring road, 3,800 fewer lorries on the road and almost 250 tonnes of CO2 saved.
Fertile fields close to the banks of the Leie allow waterways to be integrated into the supply chain. Indeed, crops can be brought by a vessel, directly from the production site, into the city centre of Ghent. The vessel has an electric sail using solar energy from its starting point Goedinge along the Leie all the way to the Ghent city centre (approximately 8 km). The investment into the vessel was supported by subsidies, thereby reducing the investment costs to be mobilised by the Goedinge farm. Operational costs for the vessel are reported to be low. The project leaders reported to be positive about the long-term viability of the project. Once the fresh vegetables arrive in the city centre the last mile to the final recipient is concluded with bicycle trailers or the vegetables can be picked up directly at the berth. The boat sails once a week with the vegetables.
The interesting aspect of this project is the network of organic farmers. Consumers register on the platform by paying an annual share of the harvest. Three different vegetable packages can then be collected. The packages differ in the number and size of vegetables included.
The project supports local farmers in guaranteeing a number of predefined customers.
However, a number of factors regarding its economic viability remain open. The sailing of the boat and its size do not necessary allow scale effects to be present, and this factor consequently creates upward pressure on prices charged to the end consumer. In a greener set-up, such higher prices might be borne by the end consumer in the form of an add-up factor on the competitive price.
Source: University of Rostock, Institute for automation engineering
The city of Berlin and its surrounding area possesses a dense inland waterway network, with the rivers Spree and Havel, and numerous canals. The capacity offered by this network for cargo transport is tremendous, but currently massively underutilised. The A-Swarm project aims to fill this gap by developing a new city logistics system according to the following main principles:40
a) Small vessel size: Development of small vessels with a length of 6 to 8 m and a width of 2.5 to 3 m, compatible for small waterways and a fine distribution of unitised cargo (goods are loaded on pallets on the vessels) within cities. The vessels are currently tested in towing tanks as well as in natural test areas.
b) Flexibility of operation: The system allows changing between two main operation modes, depending on logistical needs: 1) coupled-mode: coupled convoy (‘swarm’ of boats coupled together with a push boat) and 2) decoupled mode: self-propelled vessels operating on their own for a fine distribution of cargo.
c) Autonomous sailing: All vessels should be autonomous in order to achieve a business case from an economic point of view (no labour costs when sailing).
d) Automated transshipment: loading and unloading of cargo is carried out via ramps and roll-on/roll-off systems without hoisting cranes (no labour costs including during transshipment).
e) Electrification: the push boat, as well as the small boats, have electric propulsion, as is the case for the last-mile logistics for which electric trucks and/or bicycles are foreseen.
The type of goods that the project partners41 consider to be relevant concern: parcels, food products and beverages for shops and restaurants, waste, unitised cargo (pallets).
Automated navigation must be safe and collision free, and the vessels must be capable of ‚understanding’ the topology of waterways, which is more complex than the environment of roads for autonomous trucks or cars. The higher complexity of waterways is due to the additional dimension represented by water depth. Furthermore, water in different areas has different physical properties such as different densities, viscosities, currents or depths, and these variables have an influence on the vessel’s hydrodynamic frictional resistance and fuel consumption. This is a different situation compared to automation in road traffic, where the road surface is more a ‘constant’, rather than a variable such as a fluid like water.
An autonomous vessel must distinguish between ducks, human beings and carry out appropriate manoeuvres in each case. Over and above that, a vessel must measure water depth, currents and their variations to determine the optimum speed within a dynamical optimisation algorithm that should be integrated on a single-chip computer in the ship.42
Research in automation in inland waterway transport is ongoing, but certain scientists believe that fully autonomous vessels will not become available over the next two years.43 Of course, this also depends on the level of automation and the size of the vessel. Semi-autonomous small vessels might be available and permitted on the market earlier. Larger vessels are less likely to be fully automated, at least such concepts might not become available in the near future.
From an economic and logistical point of view, the largest port area in Berlin (Berlin Westhafen) plays an important role as a hub, where goods for the retail sector arrive per railway hinterland transport from the seaport of Hamburg. The fine distribution of these goods to retail shops in Berlin is currently carried out by trucks. With a full implementation of the A-SWARM concept, electrified boats could take over this role, at least partly, in the future. The Amazon company has already shown interest in the project for its parcel distribution.
AVATAR in Hamburg and Ghent – pilot project Source: Adobe Stock, Barkasse auf dem Nikolaifleet in Hamburg, Deutschland
AVATAR aims to develop and test innovative and sustainable urban freight transport concepts with autonomous and emission-free vessels in order to achieve a shift from road to waterborne transport in the urban context on the last mile.
The project is co-financed by the European Union from the EU Interreg North Sea Region 2014-2020 programme (European Regional Development Fund). The international structure of the project is reflected by the main project partners, from Germany (Logistik Initiative Hamburg, University of Oldenburg), Belgium (University of Leuven, Development Agency East Flanders) and the Netherlands (TU Delft).44
The focal points of AVATAR are:
– development of prototypes of automated / autonomous ship units;
– development of remote monitoring and control concepts;
– development of use cases and business cases for deployment in an urban context;
– analysis of the political and legal framework for the deployment of autonomous ship units in the participating regions;
– implementation of pilot tests.
The project partners consider automation as a necessary tool in order to develop positive business cases for small vessels. This requires electronic tools such as remote-control systems, ship-to-ship communication and programming of fairways. A first step is to develop a small vessel with a loading capacity of 10 tonnes and to carry out pilot tests, possibly in cooperation with the Hamburg Port Authority.45
Regarding the potential cargo groups, four groups are identified (waste; parcels and courier; b2b retail logistics; building materials). However, the exact outcome depends on the experiences on the economic viability during the studies and should be determined via a recursive adaptation process. Hereby, vessel technology and business cases interact and are adapted in a recursive way: vessels are designed for specific market segments and tasks, and the experiences from the business case provides feedback for the vessel technology which then needs to be adapted within vessel design.
From an infrastructural point of view, the small historical canals or ‘Fleete’46 in Hamburg near the port area, that were used for cargo transport from the Middle Ages until the beginning of the 20th century, are considered as an asset which should be used again.
TRANSPORT OF BUILDING MATERIALS – CONSTRUCTION SECTOR
Amsterdam Vaart! in Amsterdam – implemented project Source: Adobe Stock, Channel in Amsterdam, Netherlands
Due to its larger capacities, enabling the transport of large batch sizes, inland waterways can prove to be an effective tool for reducing the number of trips needed to transport construction materials in urban areas. It can also ease congestion in the city, causing an improvement in air quality and reduced pressure on the city’s road network. Moreover, water transport allows for additional storage capacity on the quay, because materials can be left on the vessel until they are processed.47 This is what the Amsterdam Vaart! project has succeeded in demonstrating over the past two years.
The project is part of the Smart and Sustainable Mobility programme of the Ministry of Infrastructure and Water Management. Launched in 2018, Amsterdam Vaart! involved a consortium consisting of the Municipality of Amsterdam, the Netherlands Organisation for Applied Scientific Research (TNO), Waternet and the Port of Amsterdam. The project tested and measured the effects of this modal shift through the consortium’s support of experimentation in nine living labs. The nine construction sites involved provided encouraging lessons on the potential of IWT in this logistics segment. The modal shift to inland waterways resulted in a 37% reduction in CO2 emissions, 1,600 fewer truck trips within the city and 19,700 fewer trips outside the city in 2019.
Transport of building material in Paris – implemented projects
The construction segment on the Seine has performed very well in recent years, as its volume was 36% higher in 2019 than in 2014. In the Ports of Paris, by far the most important segment is that of sands, stones and building materials. In 2015, it represented 68% of total waterside traffic, and this share increased further to 77% in 2017 and to 78% in 2019. Not all of these volumes reflect urban transport, some also reflect long-distance transport, as sands, stones and gravel are transported between the Benelux region and Paris. However, the urban transport projects in the construction segment have shown particular dynamics in recent years in Paris.
Due to the Covid-19 crisis, the market experienced a rapid slowdown in March and April 2020, as reported by the Haropa ports, due to the closing of important building sites. However, despite the crisis, IWT showed a certain resilience with a drop of only 3.8% in 2020. The major Parisian construction sites are driving the BTP activity (+12% at the end of November 2020), thus confirming the essential role of river transport in the construction of Greater Paris and the 2024 Olympic Games.
Grand Paris Express
Indeed, the underlying reason for the upward trend in the construction segment on the Seine and in the Port of Paris is the project Grand Paris Express, which foresees the construction of new metro lines in Paris and in the surrounding region of the Île-de-France. As part of the work on the Grand Paris Express, a partnership has been set up between HAROPA – Ports de Paris and the Société du Grand Paris to give priority to the use of waterways for the delivery of sand and building materials for this construction work and evacuation of construction debris from the site. Around 45 million tonnes of sand, building and excavation material are expected to be transported over 15 years under this project. In 2019, one million tonnes of soil were evacuated by inland vessels, which is the equivalent volume of 50,000 loaded trucks.
To this end, four river transhipment platforms are being built at the following ports, near the tunnel boring machine shafts: Île de Monsieur in Sèvres, Gennevilliers, Aubervilliers and Les Ardoines in Vitry-sur-Seine. The Gennevilliers platform was inaugurated in 2021. This platform will also overlap with the circular economy pillar. In fact, it will receive and recycle concrete from manufacturing processes, unused material from construction sites or resulting from deconstruction. Aggregates resulting from the recycling process will be sold or directly integrated into the production process of ready-to-use concrete for renovations or new constructions. Inland vessels will evacuate, where possible, the remaining non-recycled material.
The Grand Paris Express is a good example of how IWT presents further opportunities for growth in urban areas, and how public support can foster its development.
Olympic Games in Paris
The preparation for the Olympic Games in Paris in 2024 also represents such a best practice example. In this case, the French waterway administration, the Voies Navigables de France (VNF), involved in the preparation of the Olympic Games in Paris in 2024 as the contracting authority for the Olympic works delivery company (SOLIDEO), signed a protocol of commitment with HAROPA ports, SOLIDEO and the Prefect of the Île-de-France Region on 21 January 2020. The aim of this commitment is to promote river logistics in the construction of the Athletes‘ Village in Saint-Denis.
In total, the use of river transport could reach one million tonnes for all the Olympic construction sites along the Seine. VNF has set up a quay dedicated to the evacuation of spoil for the construction sites on the Île-Saint Denis. In total, 250,000 tonnes of spoil have been evacuated by waterway since May 2020 from the VNF and Ports of Paris facilities. In addition, VNF is working to develop partnerships to encourage the use of river transport in the logistics of the Games and for the aftermath.
A circular economy aims to maintain the value of products, materials and resources for as long as possible by returning them into the product cycle at the end of their use, thereby minimising the generation of waste.48 Three main words can be associated with this concept: reduce, reuse and recycle. In a scarce resource world, light is shed on mechanisms to recycle and re-use material that elsewhere would find its end of lifecycle in a waste disposal. Waste recycling embraces a large share in the pillar ‚circular economy‘, not only with regard to the collection itself but also to the valorisation of waste. In March 2020, the European Commission adopted a new circular economy action plan, one of the main building blocks of the European Green Deal.
The valorisation of waste is achieved by transforming waste into energy, mostly electricity and/or heating. Electricity generation from municipal renewable waste has increased more than ninefold within the last thirty years (see figure 1).
FIGURE 1: ELECTRICITY GENERATION FROM WASTE IN THE EUROPEAN UNION 28 (1,000 GWH)
Circularity as such does not always indicate an activity with no emissions. The focus lies on a reutilisation of products and resources, and by this circularity, a reduction in the consumption of rare resources is achieved.
Not only the vessels, but also inland ports, play an essential role in the circular economy on the supply side. As an example for an already existing market where inland navigation and inland ports are integrated into circular economy supply chains, the use of scrap steel, iron waste and metal waste for steel production can be mentioned.
In 2019, 41.3% of crude steel production in the EU took place via electric arc furnaces, in which iron residues or metal waste are smelted with the help of electricity and converted again into new steel. Inland ports and inland navigation are heavily involved in the transport of scrap steel, metal waste and iron waste. An important example is the Rhine Port of Kehl, which will be discussed further below.
As ports are mainly located close to city centres, industries or terminals, they provide a fruitful ground for the recycling industry. Indeed, the high concentration of raw materials and residual flows from numerous industrial and logistic activities which can be found in ports, and the proximity to large urban agglomerations, make them ideal places for circular economy activities. The vicinity of circular economy activities near inland ports is certainly an opportunity that inland navigation transport can seize. The European Federation of Inland Ports (EFIP) expects that the implementation of the circular economy strategy by inland ports will trigger new transport flows.49
EFIP identified some barriers to the development of circular economy activities within inland ports as follows:50
– The lack of space for the installation of collection and treatment units,
– The dependence of inland ports on the final market uptake for circular economy activities and the initiatives of individual companies,
– Reaching critical mass in a circular economy business model for certain waste in order to gain economic profitability,
– Negative public opinion about waste and waste recycling,
– Long transition process towards circular economy,
– Increased cooperation between various stakeholders involved in the circular economy transition is required,
– Multi-stage process of certain types of waste.
So that the circular economy becomes a reality for inland ports, several levers are also described by EFIP, to name but a few: an increased knowledge about the value-added applications of waste resources, standardisation and a quality scheme for secondary raw materials, as well as stable and long-term climate investment. A few examples as to how inland navigation integrates into the circular economy logistics is described in this chapter.
WASTE RECYCLING BY INLAND VESSELS IN CITIES
WASTE TRANSPORT ON THE THAMES AND ENERGY GENERATION IN LONDON
Source: Adobe Stock, Big Ben and Houses of Parliament, London, UK
The recycling and energy recovery company Cory Environmental51 collects, sorts and segregates dry waste such as plastics and other types of dry mixed recyclables as well as non-recyclable waste and transforms it into electricity.
Waste is collected from four riverside stations in London (Wandsworth, Battersea, City of London, Tower Hamlets). Barges pulled by tugs from these stations deliver non-recyclable waste to an ’energy from waste’ (EfW) facility. In this EfW facility, an incineration of waste takes place, and the steam resulting during this process drives a turbine that generates baseload electricity.
The company reports in its annual review, published in 2021,52 that in 2020 it transported 731,000 tonnes of non-recyclable waste to its EfW facility. The amount of electricity generated (501 GWh) is the equivalent of the electricity needed to supply 155,000 homes in the region of London. The EfW facility, situated in Belvedere – a district in south-east London – is located directly on the Thames. It is the only EfW facility in the UK with river infrastructure to receive waste. In total, Cory Environmental transports 1 million tonnes of waste on the Thames per year, thereby avoiding the movement of 100,000 trucks on the streets of London. It owns a fleet of 52 barges and 5 tugs and has its own repair yard for the vessels.
In the area of Paris on the Seine, various segments of household waste (see table 1) to be recycled or reused are transported on inland waterways.
Table 1 shows the waste volumes transported by the public service company SYCTOM in Paris, as one major example of urban river transport of waste in France. SYCTOM provides a public service for the treatment and collection of household waste for 85 municipalities in the Paris region. According to their activity report in 2020, SYCTOM transported 189.7 thousand tonnes of waste on inland waterways from which they have recycled in various ways 92.4% of all waste collected. Various methods of waste recycling embrace methanisation, energy recovery (electricity and steam) or reuse of recycled material.54
TABLE 1: EXAMPLE OF THE PUBLIC SERVICE COMPANY SYCTOM55 IN THE REGION OF PARIS – TRANSPORT OF WASTE BY IWT 2019-2020
Type of waste
Volume in tonnes 2019
Volume in tonnes 2020
Household waste
1,872,649
1,746,229
Household packing and paper
198,081
181,065
Organic waste
7,354
6,618
Landfill
30,225
43,219
Glass
128,078
121,521
Bulky Items
231,422
228,046
Source: SYCTOM Activity Report 2020
For the incineration of waste, filters are used that reduce the emissions. These filters are also transported by inland vessels. In June 2021, 24 new bag filters weighing 24 tonnes each were transported between Rouen and Ivry Paris XIII via the Seine. The new unit in Ivry is destined for the energy recovery from household waste through an incineration process. Ivry represents the most important recycling centre for the region of Paris.56
In 2023, the new energy recovery unit will be commissioned and will handle an annual quantity of 350,000 tonnes of residual household waste by incineration. This amounts to the collected waste volume of around 1.4 million households from the agglomeration of Paris.57 SYCTOM operates around ten recycling and sorting centres in the region Île de France.
It can also be observed that new types of waste transport are emerging in ïle-de-France, in particular through the development of container transport, which makes it possible to collect a wider variety of waste. An example is the transport of waste from Gennevilliers near Paris to Rouen. On the way to Rouen professional furniture waste is transported in containers whereas on the way to Gennevilliers containers are filled with paper waste.
The waste disposal centre in Lille, in northern France, with its two recycling centres58 in Sequedin and Halluin which are located in the northern and southern part of the city, accounts for an estimated 220,000 tonnes of household waste transported by inland vessel per year.
RIVER’TRI IN LYON
Source: Euronews (2021)
Urbanisation and waste disposal is a known challenge. As populations tend to grow and space becomes scarce, waste disposal centres in densely populated areas switch to innovative solutions due to lack of space. The city of Lyon shows how waterways can help overcome space scarcity by floating boats acting as waste disposal centres.
River’Tri in Lyon is Europe’s first floating waste disposal centre. Every year, an inland vessel collects 300 tonnes of waste from 5,000 people in the city centre of Lyon. River’Tri began in 2016 as an experimental project for two years with a budget of 1.8 million euros, 37% of which was financed by the European cohesion policy (ERDF). Since that time the Lyon metropolitan area has financed this operation (approximately 500,000 euros/year) via a service provider (SITA-Suez).
River’Tri is not only an urban river logistics project, but also a project of the circular economy, as 90% of the waste collected by inland vessel is recycled and transformed into new products (see table 2):
TABLE 2: WASTE COLLECTED BY THE RIVER’TRI INLAND VESSEL IN LYON AND NEW PRODUCTS MADE FROM THE WASTE
Waste collected by River’Tri
Bulky waste such as furniture and carpets
Paper and cardboard
Metals and wood
Electric and electronic equipment
Household hazardous waste such as paint and batteries
Textiles
Products made from the waste
Kitchens
Bathrooms
Chipboards
Wood chips (from wood of inferior quality) used as alternative fuel
Source: Euronews (2021)
The waterborne waste disposal centre in Lyon is open every Saturday from 9 am to 5 pm, when it docks along the Quai Fulchiron on the right bank of the river Saône. The city of Lyon and VNF aim to extend the availability of this inland vessel by one more day per week.
VNF reports that there is interest from private companies to introduce more river logistics services in Lyon. New services could concern the delivery of parcels or food products.59
Several quays are available in Lyon. On the Rhône, these quays are below the bridges, in hidden areas. On the Saône, the quays are visible and public, but the quayside on this river is often affected by floods in winter and spring. In addition, the historical architecture of the city centre limits the full implementation of urban river logistics infrastructure on the Saône.
KEY ROLE OF INLAND PORTS IN THE DEVELOPMENT OF CIRCULAR ECONOMY ACTIVITIES AND RELATED CARGO FLOWS
Ports are an essential player in the transition to a circular economy. They are deeply interconnected with different supply chains. Three ports will be mentioned in this section:
Port of Kehl
The Rhine Port of Kehl is one of the ten largest Rhine ports and is located near the French Port of Strasbourg, on the German side of the river Rhine. It hosts the largest German electric arc furnace steel plant. This steel production technology reutilises scrap steel and iron waste for producing new steel.
As figure 2 shows, iron waste accounted for 51% of all waterside cargo transport in the Port of Kehl (2020). The end products resulting from the circular production process of the steel plant are mainly steel bars and shapes. Total inland waterside cargo transport amounted to over 4.4 million tonnes of cargo in the Port of Kehl in 2020.
FIGURE 2: STRUCTURE OF INLAND WATERWAY TRANSPORT IN THE RHINE PORT OF KEHL (IN %)*
Source: Port of Kehl, CCNR analysis
* % values are based on port figures for 2020
Port of Moerdijk
The Port of Moerdijk focuses on embracing circularity in the port’s vision.60 One of the most important circular activities is the energy plant. It transforms animal waste into electricity and is quite unique in Europe.61 Further, the eco park of the Port of Moerdijk attracts biobased and circular projects. One of the most advanced programmes is the testing ground for pyrolysis, i. e. heating waste to high temperatures above 400°C without the supply of oxygen to generate fuel. Pyrolysis is a chemical process to gain substances out of waste such as pallets, plastic foil or sewage sludge.62
Port of Amsterdam
The Port of Amsterdam remains the frontrunner in the circular activities among all European ports. This lies within its circular economy ecosystem.63 Three companies that are engaged in different kinds of waste recycling shall be mentioned.
– Bio Energy Netherlands recycles wood chips and treats them in a gasification plant to gain syngas from which heat, electricity and hydrogen can be retrieved.64
– AEB Amsterdam processes residual waste to energy. With an incineration process that burns the waste, heat and electricity for up to 30,000 households in the north of Amsterdam are produced.65
– SUEZ Group focuses on hazardous waste. Different kinds of hazardous waste, liquid or solid, are treated to be reintroduced into the lifecycle as raw materials.66
4. NEW INLAND WATERWAY CARGO FLOWS TRIGGERED BY THE ENERGY TRANSITION
The early 21st century shows the downside turn of the fossil economic paradigm, in terms of climate change and natural disasters. The negative feedback of this phenomenon on human societies, including economic welfare, is more and more visible. The technical and economic transition from fossil fuels to alternative or renewable fuels is a complex process which is still ongoing. Fossil fuels are not only troublesome from an environmental point of view, but also from the viewpoint of their being finite and depleted, in combination with a growing global demand for energy.67
This transition implies a deep transformation for our entire economic system. This includes inland navigation, which will have to apply new technologies, transform its infrastructure, embrace social, economic and perhaps fiscal changes, and, most importantly, develop new markets. Indeed, the transition away from fossil fuels is already impacting inland navigation transport volumes.
Within this report, the use of renewables and their growing importance in the energy sector forms a framework for the analysis of potentials within transport demand in inland navigation.
Within the last 30 years, wind and solar energy have been the two segments that showed the strongest growth within renewable energies in the European Union (see figure 1).
FIGURE 1: RENEWABLE ELECTRICITY GENERATION BY MOST IMPORTANT SOURCES, EUROPEAN UNION – 1990-2020 (1,000 GWH)
Projections regarding the development of renewable energies in the near future are positive especially due to the European Commission’s efforts in meeting the objectives of the European Green Deal. With an extension of the carbon price signal to road transport and the building sector, as well as to the maritime sector, further emissions are targeted.68
Electricity generation from renewables is expected to expand by almost 50% in 2025 compared to 2019. By 2025, the share of renewables in total electricity generation is expected to be 33%, surpassing the coal-fired generation. Renewables are expected to meet 99% of the global electricity demand increase during 2020-25. In the European Union and the United Kingdom, the increase in renewables-based generation is expected to be more than nine times the rise in electricity demand between 2019 and 2025. Recent policy momentum is also perceived as a lever to give an extra boost to the use of renewable energy. For instance, the EU economic recovery plan foresees climate-related spending in areas such as buildings, grids, electric vehicles and low-carbon hydrogen.69
The aim of this chapter is to show in which fields inland navigation could benefit from these trends towards renewables, and to show also existing bottlenecks and barriers for growth in IWT in this respect.
Considering the growing importance of the energy transition and its long-term impact on inland navigation, transport of renewable energies – and related components for the generation of alternative energies – can be considered as a market that offers certain growth potentials for IWT.
This is due particularly to the large loading capacities of inland vessels, a property which is complementary to the large size and/or the large batch size of many alternative energies. Alternative energies can appear in different forms – wind, solar or hydraulic energy, solid biomass, liquid biomass (biofuel, ethanol), methanol or hydrogen.
However, there are still high uncertainties regarding energy transition pathways which our society and the different industries will follow. Such uncertainty relates in particular to prices, the availability of renewable energies, and technological development, especially zero-emission technologies.
In the context of this report, it was therefore decided to focus on three case studies, namely, transport of:
– wind turbines,
– biomass and biofuel,
– hydrogen.
TRANSPORT OF WIND TURBINES ON INLAND VESSELS
WIND ENERGY AND WIND TURBINES – OVERVIEW AND DEVELOPMENT
The growth of energy generation with wind turbines has been particularly successful in countries that offered a state-guaranteed feed-in tariff for wind power, over a period of 20 years. Due to this scheme, overall additions of capacity in the wind energy sector accelerated to meet 2030 targets. In more recent times, however, permitting challenges and grid constraints started to limit growth. It was also observed that changes in policy design (from state guaranteed feed-in tariffs towards auction systems) had negative effects on capacity growth. In France, Germany and Italy, such changes in policy design led to a sharp decline in newly built capacity.70 This mostly occurs when support schemes with rather fixed feed-in tariffs are turned into auction mechanisms that automatically remove the weakest players from the market. Hereby, ’weakness’ is to be understood as a rather high level of production costs, meaning that such a company will not be successful within an auction procedure. This limits overall growth for wind energy capacities.
In Germany, the shift in policy design took place in 2017, when state guaranteed feed-in tariffs for wind energy were abandoned in favour of auction systems. In the system that was in operation until 2017, the compensation per KWh of wind power was guaranteed by the state, and determined on the basis of scientific studies on the average costs per KWh of wind power using state-of-the-art technology. The per kWh tariff for existing wind turbines was reduced marginally year by year by a small percentage of 1.5% in order to take into account technological progress and to give incentives for productivity growth.71
FIGURE 2: WIND TURBINE AND ITS COMPONENTS
Grid operators were obliged to purchase wind power at the prices set by the State. The difference between this State price and the market price for electricity was paid by the end consumer in the form of a submission to the grid operator.
Following this subsidy scheme, the wind industry experienced considerable growth for 20 years, as shown in Table 1. Installed capacity for producing electricity from wind (both onshore and offshore) more than doubled in Rhine countries between 2010 and 2019. Between 2000 and 2010, growth had been even stronger. This last point reflects the increasing scarcity of areas for the further installation of new wind turbines. Repowering (the exchange of existing wind turbines by new, more productive ones) is one means to overcome this bottleneck.
TABLE 1: INSTALLED NET CAPACITY* (MEGAWATT) FOR PRODUCING ELECTRICITY FROM WIND ENERGY – RHINE COUNTRIES
Installed MegaWatt in year…
Growth factor
Country/Year
2000
2010
2019
2019 vs 2010
2010 vs 2000
Germany
6,095
26,903
60,721
2.3
4.4
France
38
5,912
16,427
2.8
155.6
Netherlands
447
2,237
4,484
2.0
5.0
Belgium
14
912
3,863
4.2
65.1
Luxembourg
14
44
136
3.1
3.1
Total
6,608
36,008
85,631
2.4
5.4
Source: Eurostat [NRG_INF_EPCRW]
* Both onshore and offshore capacities
Further to the already installed 60.7 GigaWatt, the German government aims to implement another 71 GigaWatt onshore and 20 GigaWatt offshore wind energy capacity by 2030, according to the new EEG policy.7273
For the same period, a similar growth (although on a lower absolute basis) is observed for Danube countries, and especially Austria. From 2000 to 2010, wind power capacity in Austria increased twentyfold, and threefold from 2010 to 2019. Croatia and Romania experienced a relevant increase in their net capacity for wind energy in the period 2010-2019 (see table 2).
TABLE 2: INSTALLED NET CAPACITY* (MEGAWATT) FOR PRODUCING ELECTRICITY FROM WIND ENERGY – DANUBE COUNTRIES
Installed MegaWatt in year…
Growth factor
Country/Year
2000
2010
2019
2019 vs 2010
2010 vs 2000
Austria
50
1,015
3,224
3.2
20.3
Romania
0.0
389
3,037
7.8
n.d.
Bulgaria
0.0
488
703
1.4
n.d.
Croatia
0.0
79
646
8.1
n.d.
Hungary
0.0
293
323
1.1
n.d.
Slovakia
0.0
3
4
1.3
20.3
Total
50
2,267
7,937
3.5
45.3
Source : Eurostat [NRG_INF_EPCRW]
* Both onshore and offshore capacities
N.d. = not defined due to value of zero in 2000
According to the DNV Energy Transition Outlook 2021 report, by 2050, wind is expected to account for 33% of the world’s electricity output, compared to 5% in 2019.74 In Rhine countries, the share of electricity produced from wind energy lies above the world’s average. By 2019, it reached 20% in Germany, 15% in Luxembourg, 10% in Belgium and in the Netherlands, and 6% in France (see figure 3).
FIGURE 3: SHARE OF WIND ENERGY IN TOTAL ELECTRICITY PRODUCTION (GWH) IN RHINE COUNTRIES (%)
Source : Eurostat [nrg_bal_peh]
In looking at the Danube countries of Austria, Croatia and Romania, similar growth trends can be observed. The three mentioned countries exceeded a 10% share in electricity production from wind energy in 2019 (see figure 4).
FIGURE 4: SHARE OF WIND ENERGY IN TOTAL ELECTRICITY PRODUCTION (GWH) IN DANUBE COUNTRIES (%)
Source: Eurostat [nrg_bal_peh]
In 2020, a total volume of 3,860 MW new onshore wind energy capacity was put out to tender by the state in Germany. However, around 32% of the tendered volume was not awarded. In the previous year, only half of the tendered volume was awarded. According to the German Ministry of Economic Affairs, only those companies with the lowest electricity generation costs would be successful in the tendering process.76
As a result, the investment in new capacities decreased sharply in Germany in the years 2018-2020, as table 3 shows.77 Another of the slowing-down factors are long approval procedures, which result primarily from lawsuits filed by parts of the population against companies that want to install new wind turbines. This opposition against wind turbines among parts of society could be a major hindrance for further growth in this sector in the future in Germany. Also, in some cases, the decommissioning of the ageing fleet of wind turbines is not accompanied by repowering (installation of new turbines at the same place), which altogether reduces capacities.
In order to unblock the situation, the German government recently introduced an ‘Investment Acceleration Act’. It was set in place in order to allow the construction of wind turbines to continue also during any litigation process.78 Furthermore, in order to speed up and achieve the targets set, in 2021, a revised version of the EEG was published to generate incentives for local communities to eliminate any restrictions on newly built wind turbines in northern Germany.79
France is a recent market in wind energy, where there is room for accelerated increase of wind capacity. Both onshore and offshore capacity is expected to increase in France. The French Ministry of Ecological Transition’s Multiannual Energy Programme (MEP) also foresees an ongoing commitment to the development of this sector. The monitoring indicators of the MEP were updated in 2021. For wind energy, the objective is to increase onshore wind capacity by 38-44% between 2020 and 2028. For offshore wind, the objective is to almost triple the capacities by 2028.80
Growth is forecast both for onshore wind, led by France, Germany and Spain, as well as offshore wind, led by the UK, the Netherlands, France and Germany.81 Nevertheless, environmental and ‘NIMBY’ (‘Not In My Backyard’) concerns seem to grow in several parts of Europe (including France) and could hinder wind power development.
It is important to state that the transport of wind turbines or their components addresses two different markets. One is the repowering of existing wind turbines and the second the construction of new wind turbines at new locations. Both cases represent a possible market for inland navigation. It is worth noting that in the case of repowering, replaced wind turbines can be dismantled and recycled as well as moved to another geographic area. In both cases, transportation of wind turbine components takes place. Depending upon regulations in the wind energy market, each of the three cases will develop its own pace and trend, and IWW transport will be affected accordingly.
TABLE 3: YEARLY ADDITIONS OF NEW WIND ENERGY CAPACITY (IN MEGAWATT) IN GERMANY, REDUCTION THROUGH DISMANTLING OF EXISTING PLANTS, AND CUMULATED STOCKS (ONSHORE, OFFSHORE AND ALL WIND TURBINES)
Onshore, in MW per year
2012
2013
2014
2015
2016
2017
2018
2019
2020
Gross additions
2,415
2,998
4,75
3,731
4,625
5,333
2,402
1,078
1,431
Thereof repowering
432
766
1,148
484
679
952
363
155
339
Dismantling
178
258
364
195
366
467
249
97
222
Net additions #
2,237
2,74
4,386
3,536
4,259
4,866
2,154
981
1,208
Cumulated stock *
31,028
33,73
38,116
41,651
45,911
50,777
52,931
53,912
54,938
# = Gross additions minus dismantling
* Cumulated stock at 31 December of each year
Offshore, in MW per year
2012
2013
2014
2015
2016
2017
2018
2019
2020
Net additions
80
240
529
2,282
818
1,25
969
1,11
219
Cumulated stock *
280
520
1,049
3,295
4,108
5,387
6,382
7,516
7,77
* Cumulated stock at 31 December of each year
Onshore and offshore, in MW per year
2012
2013
2014
2015
2016
2017
2018
2019
2020
Net additions
2,317
2,98
4,915
5,818
5,077
6,116
3,123
2,091
1,427
Cumulated stock *
31,308
34,25
39,165
44,946
50,019
56,164
59,313
61,428
62,708
* Cumulated stock at 31 December of each year
Source: Bundesverband Windenergie / Deutsche Windguard / VDMA Power Systems – Factsheets Windenergieausbau an Land; Windenergieausbau auf See; https://www.wind-energie.de/themen/zahlen-und-fakten/deutschland/ (last consulted on 27.8.2021)
In Austria, a similar decreasing trend in investment in new wind energy capacities has been observed since 2014, with some fluctuations, as shown in the following table. However, while the year 2020 saw a net reduction in terms of wind energy capacity, forecasts for 2021 are optimistic. Overall, the deployment of both wind and solar PV has accelerated, driven by feed-in tariffs and falling deployment costs.82
TABLE 4: YEARLY ADDITIONS OF NEW WIND ENERGY CAPACITY AND REDUCTION THROUGH DISMANTLING OF EXISTING PLANTS IN AUSTRIA (IN MEGAWATT)*
MW per year
2012
2013
2014
2015
2016
2017
2018
2019
2020
2021
New capacity
279
316
409
325
228
196
232
157
25
315
Cumulated capacity
1,38
1,695
2,102
2,426
2,654
2,849
2,039
3,159
3,12
3,396
Capacity reduction from dismantling
2
2
2
1
0
1
41
37
64
40
Net additions#
277
314
407
324
228
195
191
120
-39
275
Source: IG Windkraft 2021
* For 2021, forecast
# New capacity minus dismantling
In light of the above, it is clear that whether transport of wind turbines will develop or not strongly depends on the decision by public authorities to, for instance, build new wind turbine parks and their acceptance by citizens. Another aspect is the availability of space for building such parks. Indeed, once such space is saturated, it is no longer possible to build new wind turbines.
THE WIND ENERGY INDUSTRY – LOGISTICAL ASPECTS AND THE POSITION OF INLAND WATERWAY TRANSPORT
Due to the competition with other energy sources (renewable and non-renewable ones) and the public subsidies dedicated to energy transition, the economic and political pressure to reduce the production costs of renewable energies and to increase their energetic productivity over time is high.
Hence, over the years, wind turbines have grown in size and height. Regarding size, the length of rotor blades is an important factor. Turbines with longer blades have enabled more electricity to be produced with one unit, because the efficiency of the propeller increases with longer rotor blades. The wind area that is covered corresponds with longer blades.
Secondly, the height of the tower also increases productivity, as wind speed increases in higher areas. Between wind speed and energy generation, an exponential relation exists: if wind speed is doubled (growth by factor 2), energy production increases by factor 8, due to physical laws.83
From a logistical point of view, an increase in size for wind turbines makes inland vessels an appropriate mode of transport, at least in principle.
A publication of the Bundesverband Windenergie, the German Federation of Wind Energy84 confirms this, by stating that „railway transport of wind turbines plays only a minor role, due to restrictions of the maximum rotor length that can be transported by rail, to 56 metres. Hence, transporting rotor blades by rail is not possible anymore, due to the increase in their size.“85
Railways are only capable of transporting parts of the tower of a wind turbine, or components of the engine house when these are divisible. Despite its suitability for the transport of wind turbines, inland navigation accounts only for a rather small share of all logistical activities of the wind industry. The German Federation of Wind Energy writes that it „should be objectively examined whether and when inland navigation can be more strongly integrated into transport of wind energy turbines.“86
With regard to road transport, authorisations by administrative authorities are generally required to transport wind turbines. In Germany for instance, each road transport of a wind turbine must be approved by the administration, and for the approval, the use of road transport must be justified with unreasonable additional costs, if the wind turbine is to be transported via inland waterways or railways. The fact that road transport is mostly approved, shows that there is still a strong tendency against the use of inland waterways, for which there are several reasons, including a certain ‘road culture’ in logistics and in the mindset of stakeholders. A further reason for citing why road might be the preferred option are the low heights of bridges limiting transport of windmills on inland vessels, in certain cases. However, should the administrative requirements to obtain an authorisation to transport wind turbines by road become stricter, additional opportunities for inland waterway transport would arise.
While wind turbine components have long been produced in Europe, many are now produced in Asia. They are transported to Europe via seagoing vessels, IWT therefore appearing as the logical follow-up to transport them to the hinterland.87
The Bundesverband Windenergie identifies the following points which should be fulfilled in order to achieve a higher modal split share of IWT within the logistics of wind energy components:
– availability of a sufficiently high number of large inland vessels for the transport of wind turbines;
– quality requirements for waterways, locks and ports regarding size and technical conditions;
– possibility for loading and unloading of wind turbines and their components in ports;
– possibility for intermediate storage;
– minimisation of weather-related transport interruptions (high or low water);
– development of models and solutions together with the transport companies.
Such findings were also confirmed during interviews carried out with relevant actors.
INLAND WATERWAY TRANSPORT OF WIND TURBINES: INTERVIEWS WITH EXPERTS
Rhenus Donauhafen Krems is a company based in Austria and part of the Rhenus-Group, which develops tailor-made solutions for logistical needs worldwide.
In Austria, 74 newly built windmills are foreseen in 2021 compared to seven in 2020.89 The total number of existing windmills amounted to 1,307 in the year 2020 producing seven billion kWh on an annual basis. This accounts for the electricity of two million households and saves three million tonnes of CO2.90
The wind turbines address different specific markets. One is the repowering of wind turbines and the second the construction of new wind turbines. The first market embraces dismantled wind turbines due to the installment of new, more powerful ones, with a higher energetic productivity. Dismantled wind turbines are then exported to other countries, via the Port of Constanţa, in particular, to North Africa or to Central Asian countries such as Kazakhstan. The geographical focus for the first market lies in traditional wind energy countries (France, Germany, the Netherlands, Romania, Slovenia).
Given the size of wind turbines, inland vessels are considered to be a convenient transport mode. In addition, since trucks need an administrative permission to transport wind turbines, road transport bears the risk of a denied authorisation or potential higher administrative costs. Similarly, the lack of planning and information regarding possible works on highways, is a favourable factor for inland waterway transport. Given the size of wind turbines, there is no competition from rail transport which does not have the capacity to transport such cargo. Location of the port is another important aspect. Transport via inland vessels is for instance facilitated when the port is located next to the production site of wind turbines. This is for instance the case of the wind turbine manufacturer Enercon, which fixed its production site next to the Port of Krems, equipped with a special wind turbine handling system. This proximity allows the limiting of transshipment costs, given that no other mode of transport is required to transport the components between the port and the production sites.
Other factors influencing the potential of wind turbine transport by inland vessel are notably the availability of specialised wind turbines handling facilities in ports as well as intermediate storage facilities. This is true for both the repowering and the newbuilding market.
Regulatory aspects also play an important role. In particular, one bottleneck is the lengthy administrative process required for the building of new wind turbine parks. Another obstacle is rather a ‚cultural‘ one. Indeed, the mindset of shippers prefers road transport, and this is often detrimental towards IWT. This is generally due to a lack of knowledge about inland waterway transport. In addition, while this issue is not specific to the transport of wind turbines, IWT is also often perceived as a mode which is vulnerable to high and low water periods.
The evolving size of wind turbines’ components is a double-edged sword. It could be a further opportunity for IWT but also a bottleneck in case inland vessels are unable to adapt for instance, to the constantly growing size of wind blades (from 45 to 65 metres while the next generation could reach 80 metres) which is previously mentioned.
Last but not least, the high value of the wind blades (amounting up to USD 170,000) requires a great deal of caution during transport, which can be offered by inland waterway transport.91 According to Mr. Gerhard Gussmag, similar considerations are also true for the transport of hydropower plant components.
Bolk is a transport company based in the Netherlands with branches in several European countries (Germany, Austria, Romania and France). The company also manages exceptional project logistics, including inland shipping where required. In the context of wind turbine transport, several factors influence the choice of mode of transport. One of the main decisive economic criteria considered by the clients is that of costs. The mode of transport that provides the service at the lowest costs is usually chosen. However, aspects such as proximity to production sites for wind turbines favour the inland waterway transport due to well-equipped inland ports.
Nevertheless, when choosing IWT, additional costs such as transshipment charges need to be considered. These costs arise if the construction sites or final destinations are not located near the port and therefore require a further mode of transport. Given the construction site not being directly located at the port, a truck would need to first bring the components to the vessel. This includes handling costs that might, when comparing the whole logistics chain of different transport modes, favour road transport. In addition, the risk of low water and the associated service irregularities discourage the adoption of IWT as the first choice.
Road transport appears to be the more flexible and faster choice compared to IWT. Flexibility means that the company that is producing the wind turbine does not have to complete all the components at once, as trucks can pick up one component each week. However, this higher flexibility comes with higher transport costs compared to IWT. Indeed, the high loading capacities of IWT allows carrying all the components within one single journey. A factor in favour of road transport that is often relevant for logistical choices is the shorter transport time of trucks, compared to river vessels.
Because of its high loading capacities, when transporting heavy cargo, IWT is also the preferred (or even the only) choice from an environmental point of view, unless – when departing from the same point – the number of kilometres to be covered by waterway is significantly higher than the number of kilometres to be covered by road to reach the same destination. The growth in size of wind turbines is – in principle – another argument for a waterborne transport of these components. The interview partner, Mr Gerhard Wagner, confirms this trend, but adds that ports and shipowners sometimes lack the equipment to handle this growing size. On the other hand, this trend will complicate road transport probably far more (need for ultralong trucks, new axles) thereby increasing journey times, which could be comparable to those of inland vessels.
According to his assessment, there is a difficulty to innovate in inland waterway transport, in contrast with road transport which strives to remain competitive and adaptive. Stricter regulations may lead to the choice of inland waterways. In some countries, it is difficult to obtain permits for road transport, and this can produce sufficient pressure to favour inland waterway transport. However, there is resistance to this modal shift within the transport sector. This resistance seems to come from several sides which were mentioned by the interview partner:
1) Additional costs due to transshipment if the place of loading is far from an inland port
2) Less flexibility of IWT compared to road transport, due to large batch sizes in IWT
3) Embedded ‚road culture‘ among logistical companies and lack of knowledge about IWT
According to the interview partner, road transport dominates the market of wind turbine transport.
Interview with Gutmann France, a logistics company specialised in heavy cargo logistics
Gutmann Sarl is a medium sized family enterprise created in 1963 in Karlsruhe. It is specialised in national and international transport of heavy cargo (100 – 200 tonnes). Around 50% of its transport activity in Germany and France is dedicated to transport of wind turbines.
Within the wind turbines transport activity of this company, 90% of transport is related to newly built turbines and 10% to repowering activities. Regarding the modal share of IWT in the total wind turbines transport market, the director of Gutmann France Sarl, Mr Paul Schmitt, emphasised that only 10% of the total transport of wind turbines are transported by inland vessels and the remaining 90% by trucks via road transport.
This results from several factors:
– The cost factor: it is often lower for road transport as it does not involve transshipment costs and storage costs. The cost of transport is always assessed on a case-by-case basis, and such costs can play in favour of inland vessels when space on board is optimised, but it cannot always be the case.
– Bridges on inland waterways can have a strong impact on the transport capacities of inland vessels.
– Flexibility and adaptability: road transport is considered more flexible compared to inland waterway transport.
– Availability of road infrastructure to exit the port: when transported by inland vessel to a port close to the windmill park, the last mile needs to be done by road transport. As blades are becoming longer and longer by up to 85 metres, ports lack the necessary infrastructure for heavy duty vehicles to be capable of driving out of the port area. The availability of road infrastructure from and to the port is an important obstacle. Such infrastructure should be developed to increase the modal share of IWT in this segment.
– Technical aspects: it is not always technically possible to accommodate for the transport of wind turbine on an inland vessel. However, this is also true for road transport.
There are also several opportunities for transport of wind turbines on inland vessels:
– Economies of scale exist when the space on board is optimised. Such optimisation exists in particular when wind turbines are transshipped from a maritime vessel to an inland vessel. Indeed, all the components necessary to build entire wind turbines can generally be carried by maritime vessels and then transshipped on board of inland vessels, thereby avoiding storage costs and creating economies of scale.
– The fact that windmills are produced less and less in Europe and more often imported from countries such as Brazil, China, Vietnam or Poland, is an opportunity for inland waterway transport since the initial leg of the transport chain takes place on a maritime vessel.
According to the interviewer, there is untapped potential for transport of wind turbines by inland vessels. At the level of Gutmann, he sees the modal share of wind turbine transport on waterways possibly increasing to 20%compared to the 10%at present. He also sees potential for IWT in the development of new logistics concepts.
Nevertheless, according to Paul Schmitt, the market for transport of wind turbines is also very evolutive. Despite the observed decrease in investments in the last three years in particular, this market is expected to follow a positive evolution in the coming years, both in France and Germany, particularly driven by the ambitious public policy objectives with regard to the development of renewable energies and their role in the energy mix. In Germany, the 2021 Renewable Energy Act notably plans to increase solar, biomass, onshore and offshore wind capacity, to reach higher expansion goals and to raise public acceptance of their expansion. In France, the development of wind energy is more recent than in Germany and important capacities are still available, leaving further room for the development of wind energy. According to Paul Schmitt, France lags 15 years behind compared to Germany. However, there is hope for a brighter increase in this sector.
The transport of wind turbine components represents a considerable part of the company activity. In order to be acknowledged by shippers in this market segment, respect for deadlines and punctuality is very important. Mr. Hohenbild confirms that trucks are the main competitors for inland vessels for the transportation of wind turbines, while railways play a minor role. The average length of the rotor blades is around 65 metres, and the weight 20 tonnes, so that by transporting two rotor blades, the total loaded weight is only 40 tonnes. The length and loading capacity of inland vessels are largely sufficient for transporting rotor blades.
When transporting engine houses, several units (each weighing 90-100 tonnes) are often transported in one batch (up to five engine houses), resulting in a total loaded weight of 500 tonnes. Given these limited loaded weights, low waters are not problematic for the transport of wind energy components. It can therefore be a profitable market segment for rivers such as the Elbe or Danube, where low waters are relatively frequent. The limited height of bridges, on the other hand, can represent obstacles in some cases, although alternative routes are mostly feasible.
Mr. Hohenbild identifies the decrease in newbuilding activity of wind turbines in Germany as the main barrier for growth in the near future, mentioning as a main cause the paradigm shift from guaranteed State prices for wind electricity towards tender and auction procedures. This has resulted in a strong reduction of newbuilding activity (which is confirmed by figures, see table 3) and even in a transfer of production capacities from Germany to other European countries such as Portugal or Turkey. According to his market experience and observations, several companies within the wind industry have gone bankrupt in the last three years or have shifted their production sites to other countries.
The growing opposition against the installation of wind turbines amongst parts of the German population is also a major drawback regarding the further growth in this sector. Each newbuilding project is endangered by long approval procedures.
TRANSPORT OF BIOMASS AND BIOFUELS ON INLAND VESSELS
STRUCTURE AND DEVELOPMENT
Biomass used as feedstock in the energy sector can be split into biomass with high ILUC93 risk (food and feed crops) and biomass used for advanced biofuel or electricity production with low ILUC risk . The high ILUC risk94 biomass includes mainly oil plants such as rapeseed or soybean, which need to be planted in the same way as any other agricultural product. Within this report, high ILUC risk biomass/ biofuel will also be called first generation biomass and biofuel (1G), while low ILUC risk biomass and biofuel will be called advanced biomass/biofuel.
From biomass, all forms of energy can be generated – electricity, heat, fuel for transport (biodiesel, bioethanol, etc.). Rapeseed currently accounts for 80% of the raw materials from which biodiesel is produced.95 Biodiesel is blended with conventional fossil diesel, according to national blending regulations. Trucks can also use pure biodiesel. For the production of bioethanol, wheat, rye, corn and sugar beet are the primary raw materials. Bioethanol substitutes fossil gasoline and is also blended with conventional gasoline. For these blends, technical upper limits exist (‘blend wall’), due to technical vehicle standards.
In terms of the mass, rapeseed shred used as animal fodder accounts for 60% of the total output of a biomass-biofuel transition, while biodiesel and glycerin account for 40%.96 Glycerin is a by-product of biodiesel, which is used for producing detergents, tooth paste and products for the pharmaceutical industry.
As the study of the International Renewable Energy Agency (IRENA) from November 2019 points out, „practical experience in transporting and storing ethanol and biodiesel is already abundant, as these commodities are traded globally, and in the main markets (Europe, the US, Latin America) storage and handling facilities are located near major ports.“97 This statement is confirmed by two case studies presented in this chapter of the present report, regarding biomass and biofuel logistics in the ports of Mannheim and Straubing.
According to the IRENA study, the production costs for 1G biofuels are largely determined by the costs of feedstock (e.g. rapeseed), which represent 70-90% of total production costs.98 This high share makes 1G biofuel production vulnerable towards an increase in feedstock prices.
Advanced biofuels avoid any competition with food production: they are produced from lignocellulosic feedstocks such as corn stover, straw, agricultural residues, woody residues from forestry and wood processing industries (e.g. sawdust), oilseeds produced on marginal land that is unsuited for crop production, municipal solid waste and a variety of other industrial and commercial waste types.
Apart from the sustainability concerns about 1G biofuels, another advantage of advanced biofuels is that they rely on far less expensive feedstocks such as agricultural residues, and different types of waste. Waste products are low-value products by nature. However, the quality of advanced feedstocks may be more variable than for 1G feedstocks, due to their waste-type nature.99 As it is the case for 1G biofuel production, advanced biofuel production also generates coproducts with a commercial value – for example cellulose, which is used as feedstock in the paper industry.
Up until now, the commercial development of 1G and advanced biomass follows very different pathways. The production of biodiesel, based on 1G biomass, has followed a positive trend in the EU-27 during the last 15 years. The three countries with the highest production level in Europe are Germany, France and the Netherlands, which together had a share of 52% of all biodiesel production of the EU-27 in 2020 (see figure 5).
FIGURE 5: INDIGENOUS PRODUCTION OF LIQUID BIOFUELS IN THE EU-27 (MILLION TONNES)
Source: Eurostat [NRG_CB_RW]
According to the International Energy Agency (IEA), a decrease of biodiesel production of 13.6% is estimated for 2020, due to the reduction of fuel demand during the Covid-19 pandemic. The rebound in diesel demand in 2021 should lead the volumes back to the 2019 level. For the time span 2023-2025, the IEA projects a production level for biodiesel and hydrotreated vegetable oil (HVO100) in the European Union that is 5% higher than the level in 2019, and 21% higher than the level in the Covid-19 crisis year 2020.
The European Union represents the region with the highest production level of biodiesel on a worldwide scale, in front of the US, Indonesia, Brazil and Argentina.101 Data from IEA are in line with Eurostat data, by stating that France, Germany, the Netherlands and Spain are the most important biodiesel producing countries, accounting for two-thirds of EU production.
The growth process for biodiesel should not hide the fact that there have been several regulatory changes since 2005. In Germany, for example, biodiesel was exempted from taxation until 2006, in contrast to conventional fuels. This exemption was gradually removed until 2012, but at the same time, the obligation to blend a minimum proportion of biofuel with conventional petrol and diesel fuels was introduced. This policy change caused a shift from rural entrepreneur-based biodiesel production to a biodiesel market dominated by large oil distribution and agribusiness companies.102
Soon afterwards, the EU Energy & Climate Package (ECP) of 2009 established a framework for EU member countries to set national renewable energy targets, leading to the enactment of the Renewable Energy Directive (RED, 2009/29/EC). The focus then turned to sustainability concerns and to the question, ‘which renewable fuels are really sustainable?’ Food versus fuel concerns became the main reason why 1G biofuels were considered only as a second-best solution and brought advanced biofuels onto the agenda.103
It is therefore important to note that the potential of biomass/biofuel transport on inland vessels is heavily dependent upon the public policy decisions at national and European level, which either encourage or limit their development. For instance, the European Renewable Energy Directive II fixes the target according to which renewable energies should reach a share of 32% within total energy consumption by 2030. A sub-target exists for the transport sector, requiring fuel suppliers to supply a minimum of 14% of the energy consumed in road and rail transport by 2030 as renewable energy. To achieve this goal, the Directive defines a series of sustainability and GHG emission criteria that bioliquids used in transport must comply with to be counted towards the overall 14% target.
For 1G biofuels, a cap was introduced, limiting their share to 7% of the final consumption of energy in the road and rail transport sectors in each member state, and allowing therefore only for a slight increase in their production levels. The share of first-generation biofuels cannot exceed 7% by 2030 while the share of advanced biofuels shall be at least 3.5% in 2030. In the proposal to revise this directive, which was presented in July 2021 by the European Commission within the ‚Fit for 55 Package‘, the use of such 1G biofuels is being discouraged. While this proposal still has to undergo the EU legislative process, non-negligeable impacts on the biofuel sector are expected. This will consequently affect the potential for 1G biomass/biofuel production and transport by inland vessels. This is only one example of how public policy affects the development of biofuels, but other examples of this kind exist.
Given the fact that further growth of 1G biofuel is discouraged, it could be the aim to develop advanced biofuels as soon as possible, and to unchain the growth process for these fuels. However, any kind of rapid growth of advanced biofuels and related production capacities have not materialised so far.
Cellulosic ethanol production has developed very slowly and was accompanied by many failures, both technically and commercially, in the US as well as in Europe. By 2018, on a worldwide scale, only 12 refineries produced cellulosic ethanol at commercial level, and with very modest production volumes. Five of them were found in Europe, two in Brazil, three in China, and two in the US. Most of them can be categorised as demonstration projects.
The main reasons for this situation can be summarised as follows:104
– Regulatory and political uncertainties and related high risks: Biofuel markets are heavily influenced by politics, regulations, interest groups, and public opinions. Long-term investments, however, require rather stable framework conditions. It should be noted that a biorefinery takes five to ten years to develop. In addition to that, pre-project stages also have to be taken into account (business planning, feasibility analysis, engineering design, permissions regarding the contracting of feedstock, setting up supply chains, financing). Regulatory uncertainty can be very problematic for long-term projects and their financing, in particular for small start-up firms.
– High competition with conventional petro-fuels: With the technologies for advanced biofuels being immature, high learning costs and therefore high production costs must be taken into account by start-up firms. This does not make it easy to reach break-even points, and to outperform conventional petro-fuels, in particular in times when the oil price followed a downward trend, as was the case between 2011 and 2020.
– Lack of technological readiness/too high costs: In many cases, technical problems during the early production process of advanced biofuels can occur, in the start-up phase. Solutions can mostly be found, but they are so expensive that the production costs are becoming too high, resulting in a price level for the end product that the relevant market is not able to tolerate.
A prudent approach to be considered is that in the long run, advanced biofuels will be one element within the decarbonisation process of the transport sector, in parallel with electrification, but as an element which is more appropriate for heavy freight vehicles, ships and aviation which require high amounts of energy.
At the same time, regarding 1G fuels, their reliance upon food or feed crops represents a serious barrier for their further growth in the future.
Given the lack of large-scale deployment of advanced biofuels, relevant real-world examples for biomass logistics are mostly found among 1G biofuel cases. The case studies presented in this report show ports where IWT is integrated in biomass production and logistical chains. In two of three cases, the solid biomass or natural feedstock is rapeseed, which is transformed into rapeseed oil and rapeseed shred. In a further step, biodiesel is produced from rapeseed oil. In the third case, the feedstock used is wood waste, so that this third example could be considered as one that avoids any food-fuel competition (advanced biomass).
BIOMASS AND BIOFUEL WATERSIDE HANDLING IN THE RHINE REGION (PORT OF MANNHEIM)105
The Port of Mannheim is the third largest Rhine port in Germany. In the port area, an oil mill (Ölmühle Bunge) receives rapeseed mainly by ship from different regions in western Europe, stores it, and produces rapeseed oil and shredded rapeseed, the by-product used in the foodstuff segment. Most of the rapeseed oil is transported to the port’s company Mannheim BioFuel GmbH by pipeline to manufacture biodiesel which is then delivered by ship and trucks to customers (mineral oil companies, petrol stations, haulage companies). The nominal capacity of the production site of Mannheim is 120,000 tonnes of biofuel per year.106
Source: Port of Mannheim
According to the Port of Mannheim, inland navigation offers several advantages within the biomass and biofuel logistics:107
– large capacities;
– high efficiency and reliability, no restrictions at the weekend;
– few accidents.
Data have been available since the year 2005 (biomass) and 2007 (biodiesel) respectively. For all forms of biomass, higher values were recorded in 2020 compared to 2005/2007 and also when comparing the data with 2010. However, rapeseed and rapeseed shred showed high fluctuations, although this was partly caused by an accident in 2010 (fire in the oil press) (see table 5).
For rapeseed oil, a more constant growth trend can be seen from the long-term time series. The biodiesel volumes developed again differently. Although they were much higher in 2020 than in the first year of data recording for biodiesel (2007), the trend has been less positive in the last years, and the value in 2020 was indeed lower than in 2010.
TABLE 5: WATERBORNE HANDLING OF BIOMASS AND BIODIESEL IN THE PORT OF MANNHEIM (IN 1,000 TONNES)
Volumes
Growth factor
Product
2005
2010
2015
2020
2020/2010
2020/2005
Rapeseed
767
365
769
847
2.3
1.1
Rapeseed shred
269
190
360
458
2.4
1.7
Rapeseed oil
119
120
181
264
2.1
2.2
Total
1,156
675
1,31
1,568
2.3
1.4
Volumes
Growth factor
Product
2007
2010
2015
2020
2020/2010
2020/2007
Biodiesel
7
111
123
77
0.7
10.9
Source: Port of Mannheim
Figure 6 shows the data since 2013. The fire in the oil press in 2010 accounts for the strong drop in 2011. The share of rapeseed shred within the sum of rapeseed oil and rapeseed shred was 65% on average in the period from 2005 until 2020. This confirms approximately the share that is given in the literature about rapeseed and rapeseed oil manufacturing. The trend for rapeseed oil is upward orientated, while biodiesel follows a constant trend.
FIGURE 6: WATERBORNE HANDLING OF BIOMASS AND BIODIESEL IN THE PORT OF MANNHEIM (IN 1,000 TONNES)
Source: Port of Mannheim
The following table shows key figures for the Port of Mannheim, including a comparison with the regional , national and EU level with respect to inland waterway transport. The agri-food segment, of which rapeseed is a major part in Mannheim, has developed better than the average inland waterway transport between 2010 and 2020.
Waterside transport of rapeseed, rapeseed shred and rapeseed oil amounted to 1.57 million tonnes in Mannheim in 2020. These materials are counted as food products (NST 2007 group 04) and have a share of 78.4% in total waterside handling of agribulk and food products (NST 2007 groups 01 and 04 taken together) in the Port of Mannheim. Biodiesel is counted under chemical products (NST group 08).
NST 2007 product groups 01 and 04 registered a strong increase in the Port of Mannheim between 2010 and 2020, thanks to the positive evolution of rapeseed, its dominating core component.
TABLE 6: DEVELOPMENT OF TOTAL IWT AND OF TRANSPORT OF AGRICULTURAL AND FOOD PRODUCTS IN THE EU, IN GERMANY, IN BADEN-WÜRTTEMBERG, AND IN THE PORT OF MANNHEIM BETWEEN 2010 AND 2020 *
Port of Mannheim
IWT in Baden-Württemberg
IWT in Germany
IWT in the EU
Comparison IWT volume
2020 vs 2010
-9.8%
-9.5%
-18.1%
-4.8%
Comparison transport volume of agricultural products, foodstuff and food products by IWT 2020 vs 2010
+78.0%
+44.1%
-14.3%
+10.4%
Share of agricultural products, foodstuff and food products within IWT volume in 2020
29.0%
10.9%
12.4%
12.0%
Modal split share IWT (actual)
n.d.
n.d.
8.0%
6.1%
Sources: Port of Mannheim, Landesamt für Statistik Baden-Württemberg, Eurostat [iww_go_atygo] and [tran_hv_frmod], CCNR analysis
* The figures in the table are based on transport volumes (tonnes).
n.d. = no data available
BIOMASS AND BIOFUEL WATERSIDE HANDLING IN THE DANUBE REGION (PORT OF STRAUBING)109
Another example is the Danube Port of Straubing in Bavaria, the second largest Bavarian inland port after Regensburg. In Straubing, several companies active in the bioeconomy make use of inland waterways, in this particular case of the Danube.
Since its creation in 1996 the port has focused on agricultural products and biomass. Related raw materials and products represented 91% of all waterside handling in 2020. Companies active in different fields of agribusiness (trade and storage of grain), oilseeds crushing and animal feedstuff production have manufacturing and logistical capacities in the port area. The most important company is ADM, a US food processing and commodities trading company, operating internationally.
Source: Port of Straubing-Sand
Within incoming logistics, raw materials – especially rapeseed and soybeans110 – are transported on the Danube, coming mainly from Hungary, Austria and Serbia. In the Port of Straubing they are processed to rapeseed oil, soybean oil and meal.
With regard to outgoing logistics, the rapeseed oil is transported mainly by rail (tank wagons) to Mainz (where another manufacturing unit of ADM is located) and to other customers, in order to be processed to biofuel. The rapeseed meal is transported to different destinations in Germany, mainly to feed manufacturers. This transport is carried out partly by ship (50%) and partly by trucks (50%).
Soybean oil, as well as soybean shred, is exported from Straubing via the Danube, the Main-Danube canal and the Rhine to Basel/Switzerland. The background of this export is that Switzerland allows only soybean products without any genetical modification to be used in its country. As biomass products handled in the Port of Straubing fulfill this sustainability requirement, they can be exported to Switzerland.
According to Mr Rene van der Poel, General Manager of the ADM company, low water levels on the Danube can cause significant additional transport costs for the agribusiness company. As a rule of thumb, each 10 cm reduction of the water level on the Danube near Straubing causes freight rates and freight costs to increase by 10%.
However, according to the port director, Mr Andreas Löffert, the infrastructure works that have started on the local Danube stretch in 2021, after several years of preparatory studies, and which aim to deepen the fairway depth, navigating conditions are expected to be much better in the future. From 2023 onwards, vessels coming from the Rhine-Main region will be able to reach the Port of Straubing with a draught of 2.50 metres on 300 days per year. This represents a major breakthrough in terms of available draught and a more efficient connection of the port with the Rhine-Main and the ARA region.111
FIGURE 7: WATERBORNE HANDLING OF BIOMASS IN THE PORT OF STRAUBING *
Source: Port of Straubing
* Other biomass = mainly grain
According to the port director, Mr Andreas Löffert, the transshipment of dry biomass is carried out with the usual cranes and gripper arms that are present in most ports for dry cargo operations, so that additional infrastructure is not necessary.
Thanks to its orientation towards the bioeconomy, the port’s overall figures of waterside handling have developed more positively than at regional (Bavaria), national (Germany) and international (EU) level. Overall IWT in Straubing increased by 9.2% between 2010 and 2020, compared to a decrease on the regional, national and international level. The example of the Port of Straubing shows that a rather high modal split share and an overall positive development of IWT figures can be created for IWT when it is integrated into biomass supply chains.
TABLE 7: DEVELOPMENT OF TOTAL IWT AND OF TRANSPORT OF AGRICULTURAL AND FOOD PRODUCTS IN THE EU, IN GERMANY, IN BAVARIA, AND IN THE PORT OF STRAUBING BETWEEN 2010 AND 2020 *
Port of Straubing
IWT in Bavaria
IWT in Germany
IWT in the EU
Comparison IWT volume 2020 vs 2010
+9.2%
-14.2%
-18.1%
-4.8%
Comparison transport volume of agricultural products, foodstuff and food products by IWT 2020 vs. 2010
+28.0%
-3.9%
-14.3%
+10.4%
Share of agricultural products, foodstuff and food products within IWT volume in 2020
91.2%
33.8%
12.4%
12.0%
Modal split share IWT (actual)
15.7%
n.d.
8.0%
6.1%
Source: Port of Straubing, Bayerisches Landesamt für Statistik, Eurostat [iww_go_atygo] and [tran_hv_frmod], CCNR analysis
* The figures in the table are based on transport volumes (tonnes)
BIOMASS USED FOR ELECTRICITY GENERATION
Biomass is not only used for the transformation into liquid biofuels, but also for generating heat and electricity from solid biomass. This is often done in the form of combined heat and power generation. Raw materials often used for combustion are wood pellets/wood chips.
In Rhine countries in 2019, biomass (including solid biomass, liquid biofuel and biogas) accounted for 12% of electricity production in France, 8% in Germany, 5% in Belgium, 3% in the Netherlands and 1% in Luxembourg. Regarding Danube countries, we observe a constant growth of biomass in electricity production in Croatia, reaching a share of 7% in 2019. Hungary and Austria have both a share of 6%, Bulgaria 4% and Romania 1%. The share of biomass in Bulgaria is not impressive, but it is interesting that this share was below 1% until 2017, and it has since seen a sudden growth.
Installed capacity for producing electricity from biomass grew by one and a half times between 2010 and 2019. In general, all Rhine countries have increased their capacity, with the exception of Belgium, that has seen a decrease from 2010 to 2019. As the figures in table 8 also show, the growth rates of installed capacity have been reduced in the decade from 2010 to 2019, compared to the decade from 2000 to 2010.
TABLE 8: INSTALLED NET CAPACITY (MEGAWATT) FOR PRODUCING ELECTRICITY FROM BIOMASS * – RHINE COUNTRIES
Installed MegaWatt in year
Growth factor
2000
2010
2019
2019 vs 2010
2010 vs 2000
Germany
474
5460
8904
1.6
11.5
France
216
524
1374
2.6
2.4
Belgium
67
889
781
0.9
13.3
Netherlands
93
375
431
2.0
5.0
Luxembourg
0
9
47
5.1
n.d.
Total
850
7257
11537
1.6
8.5
Source: Eurostat [NRG_INF_EPCRW]
* Biomass includes solid biofuels, pure biogasoline, pure biodiesels, other liquid biofuels, and biogases.
Data for Danube countries tell a different story. From 2010 to 2019, there was an overall decrease in installed net capacity for producing electricity from biomass. In particular, Austria halved its capacity in that time period. The exception is Croatia, which increased it by more than ten times in this timespan. Overall, it can be concluded that the potential of biomass is still not made use of in Danube countries.
TABLE 9: INSTALLED NET CAPACITY(MEGAWATT) FOR PRODUCING ELECTRICITY FROM BIOMASS*– DANUBE COUNTRIES
Installed MegaWatt in year
Growth factor
2000
2010
2019
2019 vs 2010
2010 vs 2000
Austria
804
1933
978
0.5
2.4
Hungary
6
493
453
0.9
82.2
Slovakia
0
178
220
1.2
n.d.
Romania
251
20
139
6.9
0.1
Croatia
0
9
127
13.4
n.d.
Bulgaria
52
10
57
5.7
0.2
Serbia
0
0
24
n.d.
n.d.
Total
1206
3018
2428
0.8
2.5
Source : Eurostat [NRG_INF_EPCRW]
* Biomass includes solid biofuels, pure biogasoline, pure biodiesels, other liquid biofuels, and biogases
A good example of a project where biomass is used for producing electricity is the ‘Gentse Warmte Central’ (a combined heat and electricity biomass power plant) of the Belgian Eco Energy (BEE) company. The project started its construction phase in January 2020 and aims to produce green energy (heat and electricity) using wood waste that cannot otherwise be recycled. The wood waste comes from the demolition of old houses and from businesses.
The volumes of feedstock (wood residues) transformed on an annual basis amount to 160,000 tonnes. The plant is located in the North Sea Port area in Ghent. This location will allow the predominant use of inland vessels to transport the materials to the power plant. The use of inland vessels for at least 75% of the 160,000 tonnes of wood waste is foreseen according to company information. The plant will produce 156 GWh of green electricity annually (the annual consumption of about 50,000 households) and supply green heating energy to industrial customers in the area around Ghent. The biomass power plant is equipped with advanced air purification technologies and meets strict emission standards.
TRANSPORT OF HYDROGEN ON INLAND VESSELS
INTRODUCTION
Today hydrogen use is dominated by industry, namely oil refining, ammonia production, methanol production and steel production. It can also be used in the transport sector, as a fuel, or for power generation. Hydrogen can be extracted from fossil fuels, but also from renewables or nuclear power. The overwhelming majority of hydrogen is still produced from fossil fuels, so that there is significant potential for emission reduction.113
Due to its limited availability in its natural state, hydrogen must be produced on an industrial scale to be used, for instance, as an alternative fuel. Currently, there is much research on how the electrolysis process, which is needed to split hydrogen from oxygen, can be made as energy-efficient and climate-neutral as possible. Pure hydrogen can be transported as compressed gas or in liquid form. Specific requirements for the transport of hydrogen need to be respected as it is considered to be a dangerous good according to ADN regulation.
When transported as compressed gas, standards such as the pressure of up to 350 bars or 700 bars need to be respected. The hydrogen tanks inside the vessel need to withstand this pressure. The high volume and space that is needed for this kind of transport is a significant hurdle for its commercialisation.
When in liquid form, temperatures as low as – 253°C need to be created. The higher weight of liquefied hydrogen due to a higher density per cubic metre is another aspect that needs to be taken into account.
Finally, when transported in liquid form under the liquid organic hydrogen carrier (LOHC)114 technology, hydrogen is loaded on a fluid which can be transported in double hulled tanker vessels. LOHC absorbs hydrogen and releases it through chemical reactions. Advantages of this kind of transport lie in the safety, use of existing vessels and above all the high energy density in the liquid case. Furthermore, the amount carried amounts to 17 million kg H2 in a tanker vessel. To indicate a better understanding of this vast amount: a 35-wagon railway could carry up to 50 thousand kg H2 whereas a truck would carry 1.5 thousand kg H2.
The most advanced processes for the production of hydrogen are reforming from fossil sources and water electrolysis. The second option (so-called ‚green hydrogen‘) is more favourable from a climate neutrality perspective, in particular when the electricity that is used for the electrolysis is of renewable origin.
There are two main possibilities of using hydrogen for the propulsion of vehicles: the use of a fuel cell and the direct combustion of hydrogen in an internal combustion engine. In a future hydrogen economy, vessels propelled by hydrogen could transport hydrogen using the LOHC technology.
With regard to the development of hydrogen, it can be seen that recent public policy pushes for the development of hydrogen, such as the ‘Hydrogen strategy’ presented by the European Commission in 2020.115 Within the framework of the European Green Deal, hydrogen has also been singled out as central for addressing the reduction of greenhouse gas emission, preparing a climate-neutral economy and for evolving energy systems in Europe. At national level, hydrogen plans are also being deployed, and the number of countries with policies that directly support investment in hydrogen technologies is increasing, along with the number of sectors they target. Named examples are the French ‚plan de déploiement de l’hydrogène‘, foreseeing funding opportunities for the deployment of green hydrogen116 or the German ‚Nationale Wasserstoffstrategie‘.117 Green hydrogen programmes are also expected to raise renewable capacity, although investors could also use existing wind, solar PV and hydropower plants for hydrogen production.
As regards demand, it is interesting to note that demand for hydrogen has been increasing since 1975 and continues to rise. Today, clean, widespread use of hydrogen in global energy transitions faces several challenges, in particular, its cost of production from low-carbon energy, which remains very high. The fact that it is currently mainly produced from natural gas and coal, means that its production is responsible – under current conditions – for important GHG emissions. The slow development of hydrogen infrastructure is an important challenge.118 Regarding the production costs, the International Energy Agency (IEA) estimated that the cost of producing hydrogen from renewable electricity could fall by 30% by 2030 as a result of declining costs of renewables and the scaling up of hydrogen production. Among the recommendations from the IEA to support the deployment of hydrogen, one of these relates to the expansion of hydrogen in transport through fleets.
Nevertheless, the momentum towards the development of clean hydrogen is high and production of clean hydrogen, as well as the demand for clean hydrogen, is expected to rise. Transport solutions for clean hydrogen will be needed, hence representing possibly a new transport opportunity for inland vessels. The transition towards clean hydrogen will take several years, thereby leaving sufficient time for the inland waterway sector to develop suitable transport solutions.
TRANSPORT OF HYDROGEN ON INLAND VESSELS
Hydrogen as a cargo could be transported by pipelines in gaseous form or by ships in liquid form.
Green hydrogen – as mentioned earlier – is emission-free because it is generated by using renewable or low-carbon energies to split water via electrolysis and it is storable in the long term. This makes it a useful resource to decarbonise the industries and reach the emission targets at European level. The production of green hydrogen requires a high amount of green electricity that can be generated from several sources (wind, photovoltaics, hydropower).
In order to create a positive case for the transport of hydrogen on inland vessel, good access to maritime and inland waterways and ports from the green hydrogen production site is an important element. Large areas for producing green electricity (wind onshore, photovoltaics and biomass), should also be available.
Given the strong political aim in the European Union to develop green hydrogen technologies, there is momentum to support pilot projects promoting strategic value chains, such as creating a pan-European supply chain along main European corridors. Such projects are currently ongoing and important insights can be gained from them.
For instance, the most suitable form for storing and transporting hydrogen on inland vessels has to be identified, with the use of LOHC (liquid organic hydrogen carrier) technology, ammonia, liquid hydrogen or compressed gaseous hydrogen all providing different advantages and drawbacks. In order for transport of hydrogen on inland vessels to develop, the solution should be cost-efficient and easy to implement.
In light of the anticipated future needs in terms of transport of hydrogen, some inland shipping companies are already investing in a fleet adapted for the transport of green hydrogen, this is for instance the case of Chemgas Shipping BV.117
Datenschutz-Übersicht
Diese Website verwendet Cookies, damit wir dir die bestmögliche Benutzererfahrung bieten können. Cookie-Informationen werden in deinem Browser gespeichert und führen Funktionen aus, wie das Wiedererkennen von dir, wenn du auf unsere Website zurückkehrst, und hilft unserem Team zu verstehen, welche Abschnitte der Website für dich am interessantesten und nützlichsten sind.
Unbedingt notwendige Cookies
Unbedingt notwendige Cookies sollten jederzeit aktiviert sein, damit wir deine Einstellungen für die Cookie-Einstellungen speichern können.
Wenn du diesen Cookie deaktivierst, können wir die Einstellungen nicht speichern. Dies bedeutet, dass du jedes Mal, wenn du diese Website besuchst, die Cookies erneut aktivieren oder deaktivieren musst.
Drittanbieter-Cookies
Diese Website verwendet Google Analytics, um anonyme Informationen wie die Anzahl der Besucher der Website und die beliebtesten Seiten zu sammeln.
Diesen Cookie aktiviert zu lassen, hilft uns, unsere Website zu verbessern.
Bitte aktiviere zuerst die unbedingt notwendigen Cookies, damit wir deine Einstellungen speichern können!