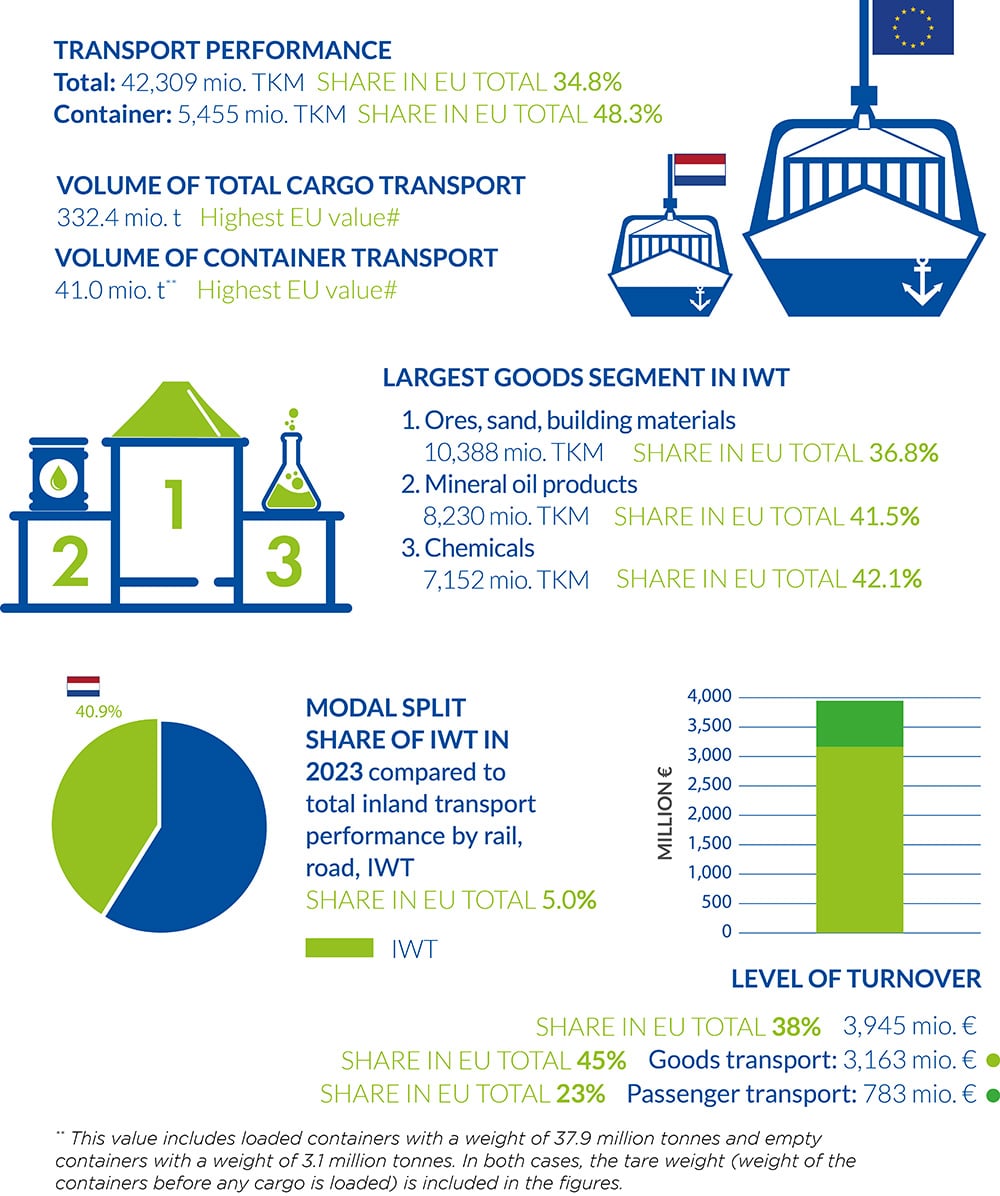
• The third chapter of this report focuses on the Netherlands, where the total volume of goods transported on inland waterways (332.4 mio. t) and of container transport (41.0 mio. t) corresponded to the highest EU values in 2024.
• The largest IWT segment in the Netherlands – that of sand, stones, gravel and building materials – has experienced a decrease in recent years due to unfavourable macroeconomic and political conditions. The Russian war of aggression against Ukraine that started in 2022 has further contributed to this decline.
• The Port of Rotterdam is the largest seaport in the Netherlands and in the EU. Its hinterland transport is heavily concentrated on the Rhine and it registered 142 million tonnes of IWT in 2024. Outgoing traffic (100 million tonnes) towards the hinterland is far greater than incoming traffic to the port (42 million tonnes). The modal share of IWT within outgoing traffic is roughly 40%.
IWT COMPANIES IN THE NETHERLANDS
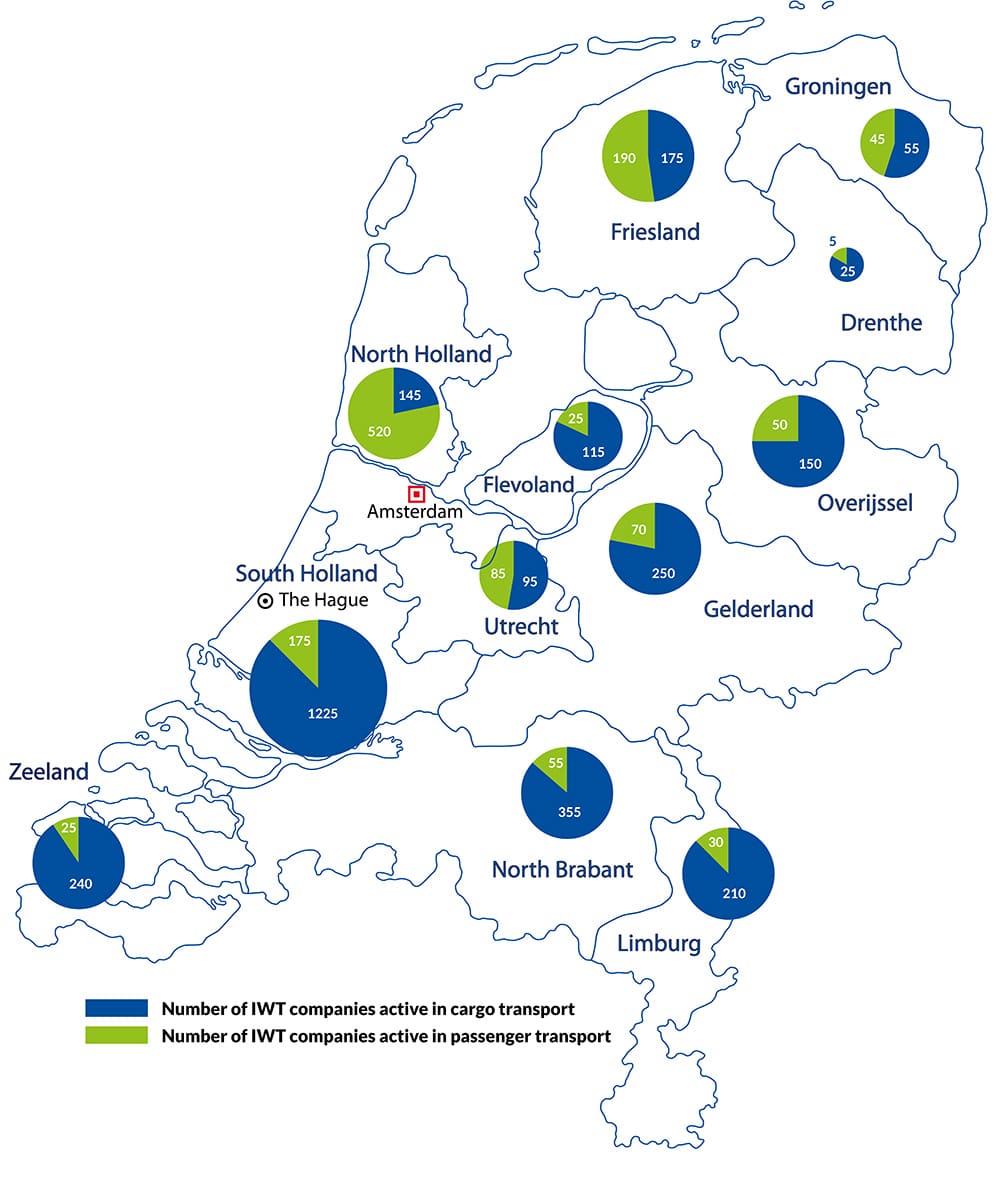
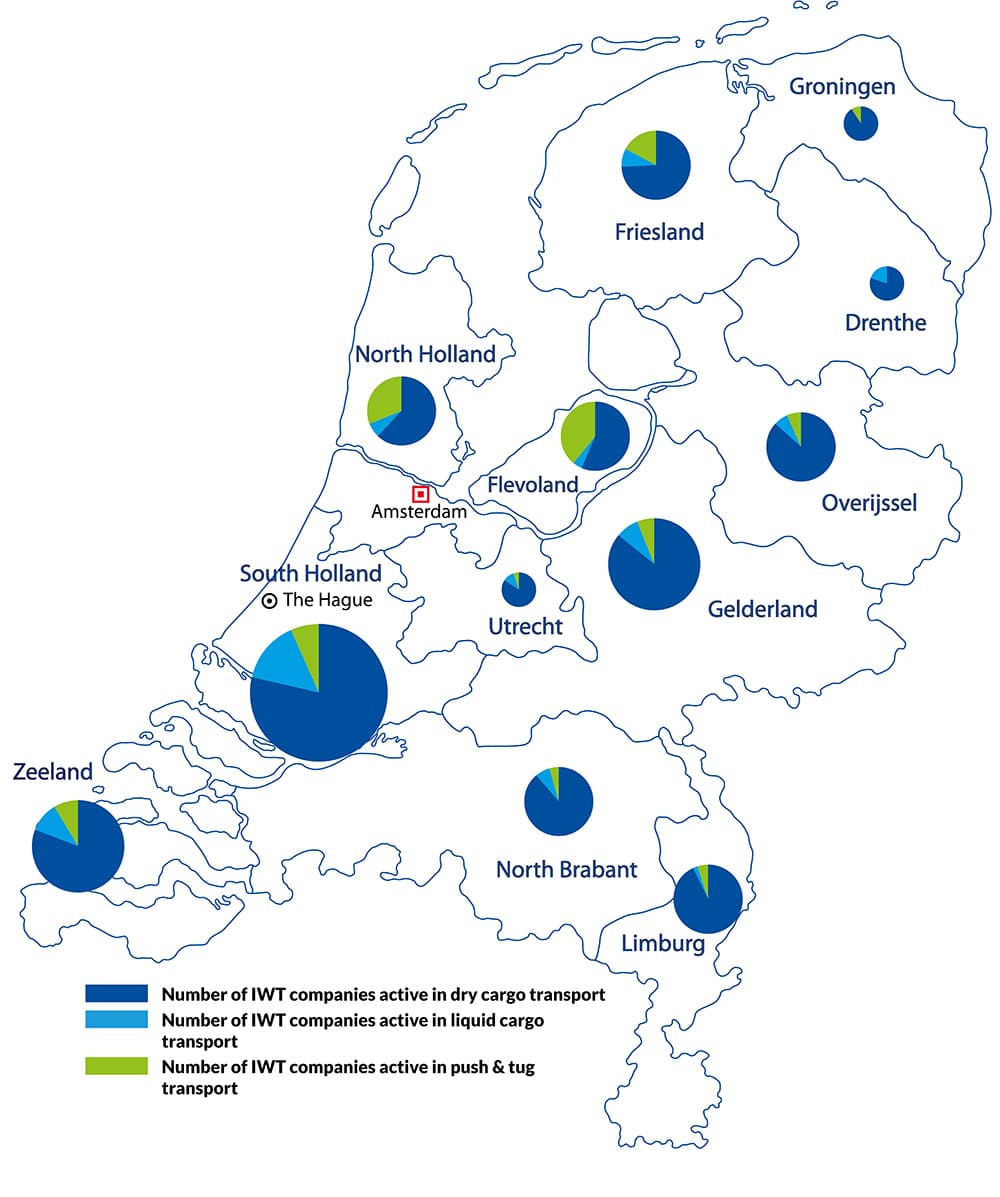
Source: Centraal Bureau voor de Statistiek (CBS)
FACT SHEET IWT IN THE NETHERLANDS
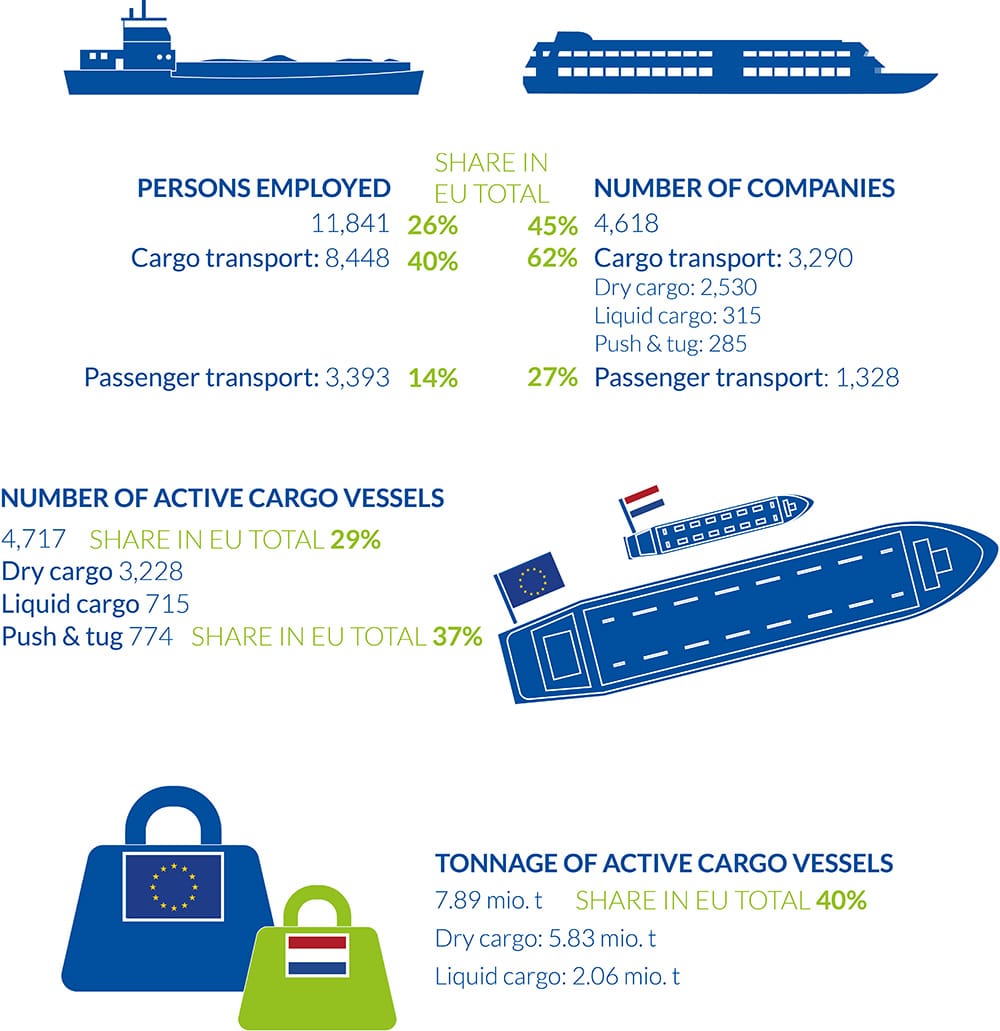
Sources: CCNR analysis based on Eurostat data [iww_go_atygo], [iww_go_actygo], [tran_hv_frmod], [sbs_sc_ovw], [iww_eq_loadcap], [iww_eq_age], Centraal Bureau voor de Statistiek (CBS), CCNR fleet database.
Notes: “Share in EU total” contains figures for the EU plus Switzerland and Serbia.
# In contrast to transport performance, for transport volume a country-specific share cannot be calculated due to double-counting problems (cross-border transport).
* No value due to missing data at EU level.
IWT GOODS TRANSPORT IN THE NETHERLANDS BY SEGMENT
- The trends in transport demand for the different product segments show a positive evolution for liquid cargo (mineral oil products and chemicals), but – in recent years – a negative trend for the largest segment of sand, stones, gravel and building materials. Many goods segments, especially container transport, have suffered under unfavourable economic conditions in Rhine countries (especially in Germany) since 2022 (high energy prices, low industry production, low construction output, slow world trade, port congestion in seaports resulting in reversed modal shift). Due to the energy transition, the trend in coal transport is negative, with the exception of two years (2021 and 2022).
FIGURE 1: STRUCTURE OF INLAND WATERWAY GOODS TRANSPORT IN THE NETHERLANDS (IN %)*
ch3_fig1_raw_data
Sources: Eurostat [iww_go_atygo], [iww_go_actygo], CCNR analysis
* % share based on tonnes of annual cargo transport in 2024.
FIGURES 2 AND 3: DEVELOPMENT OF INLAND WATERWAY TRANSPORT VOLUME IN THE NETHERLANDS BY MAIN GOODS SEGMENTS (IN MILLION TONNES)
ch3_fig2_raw_data
ch3_fig3_raw_data
Sources: Eurostat [iww_go_atygo], [iww_go_actygo], CCNR analysis
PORT OF ROTTERDAM – KEY FIGURES
- The detailed picture of outgoing and incoming cargo transport in the Port of Rotterdam is shown in the following graph. Among outgoing IWT (goods loaded), ores, chemicals and mineral oil products as well as containers and coal play an important role. For incoming traffic (goods unloaded), chemicals, container and mineral oil products are important. Ores and coal are exclusive to outgoing traffic, since they are exported towards Germany by barge. For container transport, outgoing and incoming traffic is evenly distributed.
- The Port of Rotterdam is located in the NUTS2 region of South Holland (NL36, Zuid-Holland). This is the region with the highest inland waterway transport in the Netherlands. In 2024, 107.5 million tonnes of cargo were loaded by inland vessels in this region. The largest part of this amount was loaded in the Port of Rotterdam (99.9 million tonnes, see table above).
- The cargo loaded by inland vessels in the region of South Holland represented a share of 47.8% of all cargo loaded by inland vessels in the Netherlands in 2024. For the cargo unloaded, the share of the region of South Holland was 30.0%.
- In 2024, inland waterway transport had a share of 40.4% within total cargo loaded in the region of South-Holland. Road transport accounted for 52.9% (national and foreign road vehicles), and rail transport for 6.7%. The share of IWT was slightly lower in 2024 compared to 2018.
- For cargo unloaded in the region of South Holland, the modal share of IWT was 27.3% in 2024, compared to a share of 4.3% for rail transport and 68.5% for road transport.
- Out of the entire volume of goods loaded by inland vessels in the Port of Rotterdam, 68.0% were destined for foreign countries and 32.0% remained inside the Netherlands. Differentiated by countries, 45.0% of all inland waterway cargo loaded in Rotterdam went to Germany, 32.0% remained in the Netherlands, 22.0% went to Belgium, 1% to France and 1% to Switzerland. Very minor shares (< 0.2%) are recorded for other countries (Austria, Hungary, Luxembourg, Serbia, Denmark).20
- Out of the entire volume of goods unloaded from inland vessels in the Port of Rotterdam, 48.3% originated in regions of the Netherlands and 51.7% in regions of countries abroad. Germany and Belgium are the two most important countries of origin in this regard and have a similarly high share (Belgium: 24.9%; Germany: 24.5%). The share of France was 1.3%. Other countries (Austria, Switzerland, Hungary, etc.) taken together had a share of less than 1%.
- The German region that receives by far the largest part (70.9 % of all cargo sent to Germany) of the goods by IWT from the Port of Rotterdam is the administrative district of Düsseldorf in North Rhine-Westphalia. This district is one of the most densely populated regions in Europe and includes, among others, the western Ruhr area and the Lower Rhine. Large cities such as Düsseldorf, Duisburg, Essen, Krefeld, and others are located in this region.
- The most important product within outgoing traffic between the Port of Rotterdam and German regions are mineral oil products with a share of 23.0%, followed by ores (19.0%), chemicals (18.0%), containers (14.0%) and coal (13.0%).
- The most important products of incoming traffic towards the Port of Rotterdam are containers (31.7%) and chemicals (31.2%), followed by mineral oil products (18.2%).
- For road and rail transport, hinterland statistics are only available for the entire region of South Holland (NUTS 2 level), in which the Port of Rotterdam is located. The statistics are strongly influenced by the Port of Rotterdam.
- Due to the specialisation of road transport in shorter distances, the destinations of road transport are predominantly found inside the Netherlands. The destinations of IWT and rail transport (both modes are specialized in long distances) are more often found in foreign countries.
- Within rail transport, other countries such as Italy (10.7%), Austria (5.1%) and Switzerland (3.7%) play a rather high role as a destination, as long-distance rail transport is often the most economical mode for reaching these regions.
- Germany is the primary destination for rail freight from the Netherlands.
- Overall, it can be concluded that within long distance hinterland transport of the Port of Rotterdam, inland waterway transport competes with rail transport.
TABLE 1: PORT OF ROTTERDAM – KEY FIGURES
| Indicator | Value 2017 | Value 2024 |
|---|---|---|
| Maritime traffic total | 467.4 mio. tonnes | 435.8 mio. tonnes |
| Inland waterway traffic total | 158.1 mio. tonnes | 141.9 mio. tonnes |
| - Outgoing IWT (loaded) | 112.4 mio. tonnes | 99.9 mio. tonnes |
| - Incoming IWT (unloaded) | 45.7 mio. tonnes | 42.0 mio. tonnes |
| Number of inland vessels (frequentation) | 105,000 | 91,356 |
| Modal share IWT (loaded)* | 43% (2018) | 40% (2024) |
Sources: Port of Rotterdam and Centraal Bureau voor de Statistiek (CBS)
* In the region of South-Holland, in which the Port of Rotterdam is located and where its share in IWT is roughly 93%. Modal share defined as percentage share of goods loaded by inland vessels compared to all goods loaded by IWT, rail and road transport
FIGURE 4: PORT OF ROTTERDAM – LOADED AND UNLOADED GOODS IN 2024 (IN MILLION TONNES)
ch3_fig4_raw_data
Source: Centraal Bureau voor de Statistiek (CBS)
FIGURE 5: LOADED GOODS IN THE PROVINCE OF SOUTH-HOLLAND AND THEIR DESTINATIONS IN THE HINTERLAND (2024, IN %)
ch3_fig5_raw_data
Sources: CCNR analysis based on data from Centraal Bureau voor de Statistiek (CBS)