• In the first half of 2025, inland navigation transport performance in the EU reached 58.7 billion tonne-kilometres (TKM) (-4.6% compared to the same period in 2024). Most European countries saw a decline in transport demand.
• Freight transport on the entire Rhine totalled 135.0 million tonnes, a decrease of -6.0% compared to the same period in 2024. Almost all cargo segments contributed to the decrease as a result of macroeconomic, industrial and geopolitical factors. Coal transport and container transport were the exceptions to this downward trend.
• The Danube market faced multiple challenges such as the Russian war of aggression against Ukraine, together with worsened macroeconomic and hydrological conditions. As a result, cargo transport on the Danube diminished strongly.
• Compared to the first half year of 2024, the activity of river cruise vessels on the Rhine has increased by +7.6%. On the Danube, the growth was particularly strong regarding the number of river cruise vessels (+52.4%) as well as the number of passengers enjoying these river cruises. The cruising activity also followed a positive trend on the Moselle (+10.0%).
FREIGHT TRANSPORT PERFORMANCE IN EUROPE
TRANSPORT PERFORMANCE IN IWT ON THE NATIONAL TERRITORY OF EACH COUNTRY IN EUROPE – COMPARISON BETWEEN Q1+Q2 2024 AND Q1+Q2 2025 (IN MILLION TKM) *
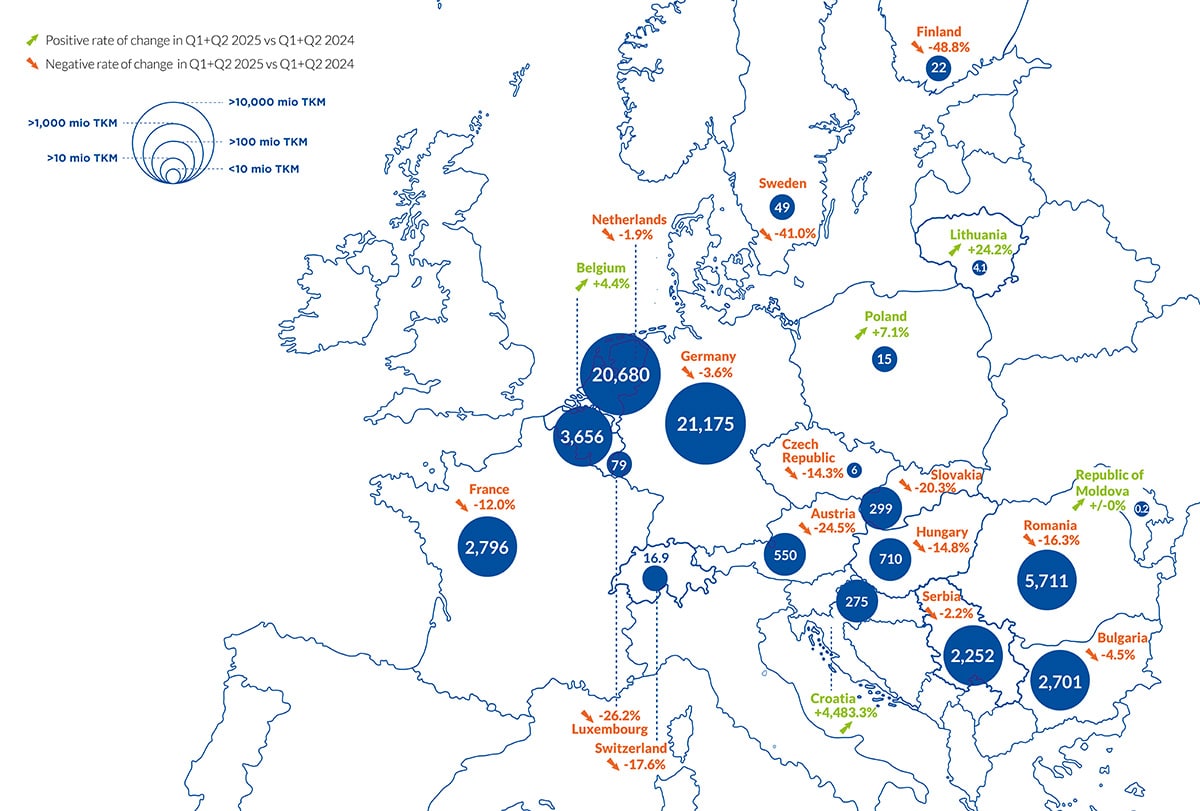
Sources: Eurostat [iww_go_qnave], OECD (Switzerland, Lithuania and Republic of Moldova)
* For the UK and Italy, data are not available on a quarterly basis.
For Ukraine, data are not available. The strong growth rate in Croatia is explained by the fact that up to 2024, Croatia did not report on transit data for the quarterly data. In the case of Croatia, about 98% of all reported transport is actually transit transport.
For Belgium, figures in previous Market Insight reports were estimated based on data from De Vlaamse Waterweg and SPW Service public de Wallonie.
TRANSPORT PERFORMANCE IN MAIN EUROPEAN IWT COUNTRIES
FIGURE 1a: INLAND WATERWAY TRANSPORT PERORMANCE IN MAIN WESTERN EUROPEAN IWT COUNTRIES (IN MILLION TKM, QUARTERLY DATA OF TRANSPORT PERFORMANCE ON THE NATIONAL TERRITORY OF EACH COUNTRY)
ch1_fig1a_raw_data
Source: Eurostat [iww_go_qnave]
FIGURE 1b: INLAND WATERWAY TRANSPORT PERFORMANCE IN MAIN CENTRAL AND EASTERN EUROPEAN IWT COUNTRIES (IN MILLION TKM, QUARTERLY DATA OF TRANSPORT PERFORMANCE ON THE NATIONAL TERRITORY OF EACH COUNTRY)
ch1_fig1b_raw_data
Source: Eurostat [iww_go_qnave]
DRY BULK, LIQUID BULK AND CONTAINER TRANSPORT IN MAIN IWT COUNTRIES AND REGIONS IN THE FIRST HALF YEAR *
FIGURE 2: DRY CARGO TRANSPORT (IN MILLION TONNES)
ch1_fig2a_raw_data
ch1_fig2b_raw_data
FIGURE 3: LIQUID CARGO TRANSPORT (IN MILLION TONNES)
ch1_fig3a_raw_data
ch1_fig3b_raw_data
FIGURE 4: CONTAINER TRANSPORT (IN MILLION TONNES)
ch1_fig4a_raw_data
ch1_fig4b_raw_data
Sources: Eurostat [iww_go_qcnave], Destatis, Rijkswaterstaat, Centraal Bureau voor de Statistiek (CBS), StatBel, Voies navigables de France (VNF), Romanian Institute of Statistics
* The data include total IWT on the territory of the country/region.
RHINE AND DANUBE NAVIGATION
- In the first half of 2025, inland waterway transport performance in the EU reached 58.7 billion tonne-kilometres (TKM) (-4.6% compared to the same period in 2024). Most European countries saw a decline in transport demand.
- Transport performance on the entire Rhine (from Basel to the North Sea) amounted to 30.0 billion TKM in the first six months of 2025, compared to 31.1 billion TKM in the first six months of 2024. This represented a decrease of -3.8%. Regarding transport volume measured in tonnes, freight transport on the entire Rhine amounted to 135.0 million tonnes in the first half year 2025, compared to 143.6 million tonnes in the same period of the previous year. This represented a decrease of -6.0%.
- Almost all cargo segments contributed to the decline. Compared to previous years, when only dry cargo segments lost volumes, both dry and liquid cargo segments showed a negative evolution. The only exception was the transport of solid fuels (coal), which increased by +10.9%, and container transport (+0.9%). The reasons for the increase in coal transport was a replenishment of stocks for coal, low coal prices and a temporary decline in alternative energy production (wind, solar energy) due to less favourable weather conditions. It is important to note that the increase in coal transport in the first half year of 2025 can be regarded as only temporary, as the general trend in coal transport is downward orientated. Container transport could stabilise, although the result was still well below the result of earlier years.
- If the entire transport demand on the Rhine is regrouped by types of cargo, then the following picture emerges. In the first half of 2025, dry cargo had a share of 47.2%, while liquid cargo accounted for 41.0% and container transport for 11.9%.
- The reasons for the decline in Rhine transport in the first half year 2025 were manifold and can be grouped into two main categories.
- Many industries that determine transport demand on the Rhine have not been well placed for several years. The chemical industry in the EU-27 experienced a disappointing first half of the year 2025: demand was weak, the business climate deteriorated and competitiveness remained below the pre-crisis average (2014–2019), mainly because of high production costs. Compared to the USA, European gas prices were three times higher during the period January-July 2025, keeping European producers at a competitive disadvantage. In the EU-27, chemical output decreased by -2.4% in the first half year 2025, and by -2.7% in Germany.1
- The share of chemical products within total cargo transport on the Rhine amounted to 12% for the traditional Rhine and to 17% for the entire Rhine from Basel to the North Sea.
- The share of mineral oil products amounts to 19% for the traditional Rhine and 23% for the entire Rhine. The reasons for the drop of -6.2% in the first half year are both the low water situation in April 2025, and a rather mild winter which did not generate the need for much additional heating oil demand in March. Likewise, the future market for gasoil was marked by a tendency of lowering of prices. This leads to less transport of mineral oil products to storage depots in the Rhine hinterland. In addition, due to falling prices, it became cheaper for some refineries to produce fuel rather than import it from the ARA region, leading also to a decrease in transport on the Rhine.
- The steel industry also experienced a disappointing first half year 2025. German crude steel production fell by -11.6%2 in the first half of 2025 compared to the first half of 2024, to around 17.1 million tonnes. For the entire year of 2025, the reduction was -9%. Since the reunification of Germany, a similarly low figure of steel production – as in 2025 (34.1 million tonnes) – has only been recorded during the global financial crisis of 2009. The situation of the steel industry is important for goods transport on the Rhine, as 25% of all cargo transport on the traditional Rhine depends directly on steel production. The commodities and goods that are transported for the steel industry on the Rhine are iron ore, scrap steel, coking coal, metals and metal products. For the entire Rhine, the share of steel industry related cargo is 16%. The Rhine is an essential transport mode, in particular for the German steel industry. In 2024, inland waterways had a modal split share of 31.6% within all transport volumes that were moved for the German steel industry. This share has even shown a slight upward trend since 2011.3
- The steel industry along the Rhine currently suffers from a combination of problems. First of all, there was a low steel demand from important industries in Germany, such as the automobile, construction and mechanical engineering industries. There is also a high competition from low-cost steel from China and India, which makes it difficult for the European steel industry to keep its market share. Furthermore, the energy intensive steel industry is facing high energy prices, as does the chemical industry. Finally, the pressure to decarbonise its steel production and the needed transition towards green steel production (using hydrogen) is accompanied by high costs.
- In France and Germany, the construction sector has been somewhat weak since the beginning of 2020, with a reduction in production output. For the Netherlands and Belgium, the construction output followed a rather stable trend. The reduction in France and in Germany can explain the negative development for the transport of sand, stones and gravel in the first half year of 2025.4
- Global trade was more resilient than expected in the first half of 2025, which benefited container traffic on waterways.
- In the first nine months of 2025, there was not a single day on which the water level at Kaub fell below the equivalent water level (EWL). However, this result masks two phases in which the water levels fell sharply. These two phases were March and April 2025 on the one hand, and June and the beginning of July 2025 on the other hand. Falling water levels, even if they do not reach the equivalent water level, lead to a lower available draught for vessels and therefore to a reduction in the available cargo carrying capacity of each vessel. This reduces the entire available capacity of the fleet. During low-water periods, the entire cargo transport is reduced. Therefore, although water levels remained above the Equivalent Water Level and no major hydrological crisis occurred, temporary periods of reduced water levels may still have affected the loading capacity and operational efficiency in certain river sections.
- Falling water levels during the first half of April led to a low point on 13 April 2025, when the daily average at Kaub reached 79 cm, only 2 cm above the critical low-water level (EWL in Kaub is 77 cm). Water levels recovered afterwards and in May, before falling again in June.
- Although Kaub is the major gauge station to assess the impact of low waters, it is only one of several gauge stations on the Rhine. An analysis of the data for other important stations reveals an even clearer tendency towards low water on the Rhine in 2025. Table 2 shows that water levels were lower than the critical lower threshold over several days in Basel, Maxau, Oestrich and Emmerich. Therefore, the first three quarters of 2025 showed a low-water period on the Rhine, in particular on the Upper Rhine in April 2025.
- A comparison between the monthly figures of Rhine cargo transport in the first half year of 2024 and 2025 shows that the figures in 2024 were consistently higher than in 2025. The highest gap between 2024 and 2025 occurred in April. This observation, together with the hydrological situation in the same month (see text above), suggests that the water level conditions had a negative influence on Rhine transport in the first half of 2025.
- While taking into consideration only the traditional Rhine,5 during the first semester of 2025, it can be observed that cargo transport amounted to 67.2 million tonnes, compared to 75.1 million tonnes in the first semester of 2024. This represents a strong decrease of -10.5% which is more than for the entire Rhine.
- The transport data for the traditional Rhine can be split into upstream and downstream transport. The individual freight segments have traditionally been more oriented towards upstream, or towards downstream transport. This orientation results from the location of the industrial sectors or the export directions of raw materials. For example, sand, stones and gravel are mainly transported downstream because these raw materials are mainly found in the Upper Rhine region. Iron ore, mineral oil products and coal are predominantly transported upstream, as these commodities are imported from overseas and transported to the hinterland to the steel industry and the energy sector.
- The trends per goods segment for the traditional Rhine are the same as for the entire Rhine. All major cargo segments experienced a decline in the first half of 2025, with the exception of coal transport.
- A long-term picture of the monthly cargo transport on the traditional Rhine shows the influence of the economic crisis and low-water periods. These are recognisable as V-shaped periods. Important low-water periods since January 2000 occurred in the years 2003, 2005/2006, 2015, 2016/2017, 2018 and 2022. The time series of traditional Rhine transport since January 2000 shows a type of level shift after the financial crisis of 2008/2009/2010. Average cargo volumes never returned to the previous volumes following this crisis.
- The low water periods in 2015 and in 2016/2017 seem to have resulted in a decoupling of Rhine transport from the trend in industry production that was present at this time. Since mid-2018, German industry production has been following a negative trend, which has had a profound impact on the trend of goods transport on the Rhine.
- Altogether, the reasons for the decline in Rhine goods transport seem to be a combination of the negative trend in German industrial production and the low water periods that have occurred in the last ten years.
- On the Danube, transport performance6 reached 12.5 billion TKM in (Q1+Q2) 2025, representing a decrease of -10.0% compared to the first half year 2024.7 The Danube market was characterised by several influencing factors, which can be grouped into three categories.
- The Russian Federation intensified its attacks on Ukraine’s Danube infrastructure. Therefore, the Danube transport market, in particular on the lower Danube, faced additional risks. During the first half of 2025, Russia carried out air strikes on Ukraine’s Danube port infrastructure and adjacent facilities. As a result of the attacks, grain hangars, warehouses and administrative buildings were destroyed, and vessels engaged in cargo operations were seriously damaged. These attacks have created conditions that pose a direct threat to the security of Ukraine’s Danube port infrastructure, but also to the entire shipping system on the Lower Danube.
- The macroeconomic situation and the situation of the industrial sectors important for Danube navigation were generally similar to those in the Rhine region. This applied above all to the steel industry, whose share of the Danube market was 23% in the first half of 2025 (at the Upper Danube).
- According to EUROFER,8 the European Steel Industry Trade Association, the current trend in EU steel consumption continues to reflect weak demand conditions. The assessment of EUROFER on the European steel market is not only relevant for the Danube market but also for the Rhine market. This situation regarding steel consumption already started in the second quarter of 2022 due to war-related disruptions, coupled with unprecedented increases in energy prices and production costs. This negative trend has persisted, mainly as a result of growing global economic uncertainty, overall manufacturing weakness and growing uncertainty surrounding US tariffs.
- In 2025, contrary to earlier expectations of a more favourable industrial outlook and improving steel demand, apparent steel consumption is set to decline again, albeit more moderately than previously foreseen. This will be driven by the expected – albeit difficult to quantify – impact of US tariffs and the resulting uncertainty and trade-related disruptions. In 2026, steel consumption is projected to finally recover (+3.1%), conditional on a positive evolution of the industrial outlook and an easing of global tensions, both of which remain unpredictable at this stage.
- For the second largest Danube market, the transport of grain, the outlook is better for the second half of 2025 and the first half of 2026. An increase in transport activity is foreseen, due to an increase in key indicators in the agricultural sector.
- Throughout the first half of 2025, water levels on the Danube were generally lower than in the first half of 2024. At the same time, in the first quarter of 2025, water levels on the Danube were mostly maintained above or around the Low Navigable Water Level (LNWL), which is the Equivalent Water Level for the Danube. In the first half of the month of March, water levels dropped below the LNWL for several days. Overall, according to the Danube Commission, water level conditions in the first quarter of 2025 allowed vessels to be loaded to a draught of 2.5-2.7 metres when going upstream and to a draught of 2.2-2.4 metres when going downstream. These conditions were comparable to the first quarter of 2024.
- In the second quarter of 2025, water levels on the Danube were mainly maintained above the LNWL, but the monthly lowest levels were on average lower than in the second quarter of 2024. In addition, on the Upper Danube in the second half of May and June, water levels occasionally dropped below the LNWL. Furthermore, there was a sharp drop of water levels below the LNWL on the Lower Danube at the end of June. Overall, the available draught in Danube navigation in the second quarter 2025 was significantly lower than in the second quarter of 2024. For upstream traffic, the available draught in Q2 2025 was 2.3 metres compared to 2.7 metres in Q2 2024. For downstream traffic, the available draught in Q2 2025 was 2.1-2.3 metres compared to 2.3-2.4 metres in Q2 2024.
- Altogether, hydrological factors in the first half of 2025 were less favourable than in the first half of 2024, which contributed to the decline in cargo transport on the Danube during that semester (see following text).
- The present assessment of Danube navigation is based on cargo volumes measured at three different geographical points: German-Austrian border, Slovakian-Hungarian border and Danube-Black Sea Canal.9
- At the German-Austrian border (Upper Danube), cargo transport in the first half year 2025 amounted to 1.16 million tonnes, which was 22% below the result of the first half year 2024. At the Slovakian-Hungarian border (Upper Danube), registered cargo transport amounted to 2.10 million tonnes, which represented a decrease of -11% compared to the first half year 2024. Almost half of all cargo passing the Slovakian-Hungarian border (49%) was carried by pushed convoys. Another characteristic of this border point was a significant decrease in the transport of food products and grain. The following two graphs show the transport demand at the Upper Danube at the border point of Gabčíkovo. While upstream transport decreased, downstream transport witnessed an increase for all three major cargo segments.
- In the Lower Danube region, freight transport on the Danube-Black Sea Canal amounted to 6.9 million tonnes, compared to 10.2 million tonnes in the first half year 2024 (-32%). The reason for this strong decrease is the normalisation of maritime grain exports from the Ukraine. When the maritime export routes were blocked, Ukrainian grain was exported via inland waterways in the Danube region.
- As was the case for transport volumes on the Danube, waterside cargo handling (in tonnes) in most Danube ports decreased. The strongest relative decrease of cargo turnover (in tonnes) was registered for Ukrainian Danube ports (-56.5%), followed by Romanian Danube ports (-30.9%). At the same time, Ukrainian and Romanian ports account for the highest cargo turnover (in tonnes) in the Danube region, together with Serbian ports. The strong decrease in cargo handling in Ukrainian and Romanian ports can be explained by a sharp decrease in the turnover of cereals. An explanation for this is the re-establishment of the maritime export routes for Ukrainian cereals, with the effect that inland waterway transport via Ukrainian and Romanian inland ports was reduced.
- Cargo turnover developed also negatively for German Danube ports (-19.5%), Austrian ports (-7.3%) and Hungarian ports (-6.5%). A positive development was observed for Serbian Danube ports (+2.5%) and Slovakian Danube ports (+11.2%).
FIGURE 5: TRANSPORT PERFORMANCE ON THE ENTIRE RHINE AND THE DANUBE PER QUARTER (IN MILLION TKM)
ch1_fig5_raw_data
Sources: Eurostat [iww_go_qnave], Destatis, Rijkswaterstaat, Voies navigables de France (VNF), CCNR analysis
* Entire Rhine = Rhine from Rheinfelden (CH) to the North Sea (including link to Antwerp via the Rhine-Scheldt link)
** Danube = TKM in all Danube countries but without Ukraine
RHINE
TABLE 1: FREIGHT TRANSPORT ON THE ENTIRE RHINE IN THE FIRST HALF OF 2022, 2023, 2024 AND 2025, BY MAIN FREIGHT SEGMENTS *
| First half year 2022 in million t | First half year 2023 in million t | First half year 2024 in million t | First half year 2025 in million t | Rate of change 2025/2024 in % | |
|---|---|---|---|---|---|
| Total transport | 155.7 | 145.7 | 143.6 | 135.0 | -6.0 |
| Mineral oil products | 30.7 | 31.7 | 32.8 | 30.8 | -6.2 |
| Chemical products | 26.1 | 22.8 | 24.7 | 22.6 | -8.4 |
| Sand, stones, gravel | 26.4 | 25.7 | 23.5 | 21.4 | -8.5 |
| Container | 17.5 | 14.8 | 14.6 | 14.7 | +0.9 |
| Agribulk and foodstuff | 15.2 | 13.6 | 14.0 | 13.2 | -5.5 |
| Iron ore | 11.1 | 11.3 | 11.5 | 8.9 | -22.8 |
| Solid fuel (coal) | 14.4 | 11.8 | 8.6 | 9.5 | +10.9 |
| Metals and metal products | 8.3 | 7.5 | 7.5 | 7.5 | +0.1 |
Sources: Destatis, Rijkswaterstaat, CCNR analysis
* The sum of the main freight segments does not correspond to total transport as only the major freight segments were chosen.
Entire Rhine = Rhine from Rheinfelden (CH) to the North-Sea (including link to Antwerp via the Rhine-Scheldt link)
FIGURE 6: TRANSPORT OF GOODS ON THE ENTIRE RHINE PER QUARTER (IN MILLION TONNES)
ch1_fig6_raw_data
Sources: Destatis, Rijkswaterstaat, Voies navigables de France (VNF), CCNR analysis
1) Macroeconomic and industrial factors
2) Hydrological factors
TABLE 2: NUMBER OF DAYS ON WHICH THE WATER LEVEL WAS LOWER THAN THE EQUIVALENT WATER LEVEL (EWL), PERIOD: Q1-Q3 2024 AND Q1-Q3 2025
| Gauge station | Number of days < EWL in Q1-Q3 2024 | Number of days < EWL in Q1-Q3 2025 |
|---|---|---|
| Basel (Upper Rhine) | 0 | 12 |
| Maxau (Upper Rhine) | 0 | 10 |
| Oestrich (Middle Rhine) | 0 | 7 |
| Kaub (Middle Rhine) | 0 | 0 |
| Cologne (Lower Rhine) | 0 | 0 |
| Duisburg-Ruhrort (Lower Rhine) | 0 | 0 |
| Emmerich (Lower Rhine) | 0 | 3 |
Sources: CCNR analysis based on data from the German Waterways and Shipping Administration (WSV), provided by the Federal Institute of Hydrology (BfG)
FIGURES 7 AND 8: TRADITIONAL RHINE TRANSPORT VOLUME UPSTREAM AND DOWNSTREAM FOR MAJOR CARGO SEGMENTS (IN MILLION TONNES, FOR Q1-Q2 OF 2024 AND 2025)
ch1_fig7_raw_data
ch1_fig8_raw_data
Sources: CCNR analysis based on Destatis – statistics for the entire Rhine according to upstream or downstream direction not available
FIGURE 9: MONTHLY CARGO TRANSPORT ON THE TRADITIONAL RHINE INCLUDING A 5-MONTH MOVING AVERAGEAND MONTHLY GERMAN INDUSTRIAL PRODUCTION *
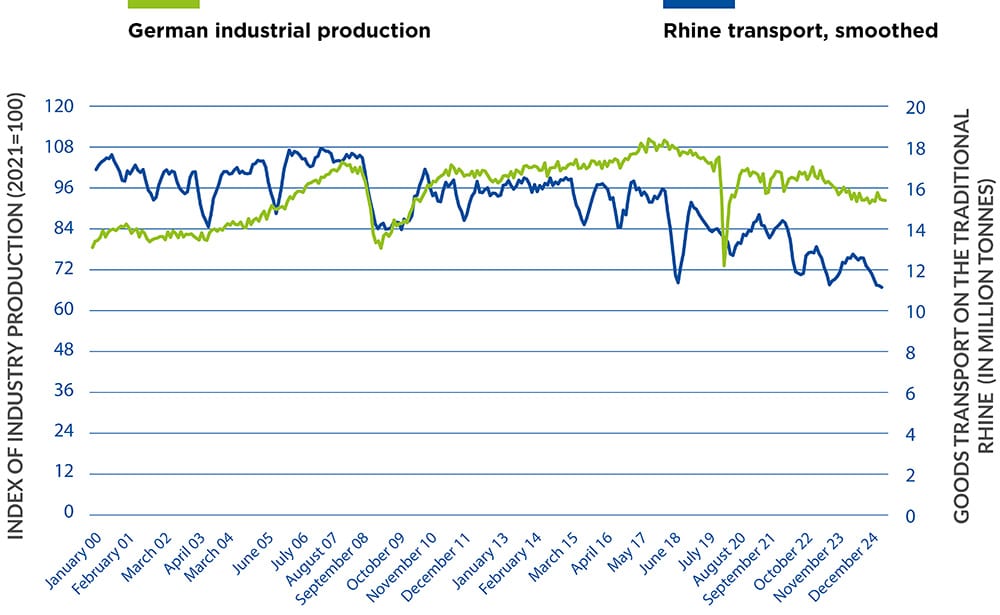
ch1_fig9_raw_data
Sources: CCNR analysis based on Destatis
* The 5-month moving average is used to smooth the original series. Industrial production is measured as calendar and seasonally adjusted production in the manufacturing sector.
DANUBE
1) The Russian war of aggression against Ukraine
2) Macroeconomic and industrial factors
3) Hydrological factors
FIGURES 10 AND 11: UPPER DANUBE* TRANSPORT VOLUME UPSTREAM AND DOWNSTREAM FOR THE MAJOR CARGO SEGMENTS (IN MILLION TONNES, FOR Q1-Q2 2024 AND 2025)
ch1_fig10_raw_data
ch1_fig11_raw_data
Source: Danube Commission market observation report
* Border point of Gabčíkovo (border between Slovakia and Hungary)
PASSENGER TRANSPORT IN EUROPE
- Passenger transport was highly impacted by the Covid-19 crisis in 2020 and only began to recover in the second semester of 2021. This recovery process has continued ever since.
- The Danube, as well as the Rhine and its Moselle, Main, Neckar and Saar affluents, are important operating areas for river cruises in Europe, alongside the Seine, Rhône and Douro. In terms of passengers transported, the Rhine and Danube are the major rivers for cruises. The main statistical measurement point for cruise vessels on the Rhine is the lock of Iffezheim on the Upper Rhine, which is representative of Rhine river cruises.
- With 1,217 cruise vessels having passed through the lock of Iffezheim in the first half year 2025 (quarter 1 and 2), an increase of +7.6% was observed compared to the first half year of 2024 (1,131 cruise vessels).
This figure is also far higher than the figure for the same period in 2019 (increase of +12.9%), which shows that cruises on the Rhine have recovered from the pandemics. - As figure 12 shows, cruising activity is highest in the second, third and fourth quarters of a given year. Lower figures in the first quarter of each year can be attributed to a partial suspension of river cruise activity, as vessels generally undergo maintenance and possibly refurbishment during this period, and crew members often take holiday at this time. Whereas in the past, ships used to sail from Easter until the autumn, most operators now offer trips beyond autumn until Christmas/New Year’s Eve. This explains the rather high values in the fourth quarter of 2024. Based on quarterly data, the extension of the season into the fourth quarter can so far be observed for the Rhine in particular, but to a lesser extent also for the Danube and the Moselle (see figures below).
- An analysis of the half-year figures for river cruise traffic on the Rhine in the period 2013-2025 shows a growing trend, which was only interrupted for two years in 2020 and 2021. The result in the first half year of 2025 was more than twice as high as in the first half year of 2013. This doubling of river cruise activity over only 12 years confirms the strong growth trend in this industry.
- For the Danube, data are available for two measurement points at the Upper Danube: the lock of Jochenstein at the German-Austrian border near Passau, and the lock of Gabčíkovo at the Slovakian-Hungarian border. The reason for the importance of these two measurement points is that they register cruises from Passau or Vienna to Budapest. These cruises have a duration of five, seven or eight days. They show much higher figures than the cruises in the direction of the Lower Danube (with a duration of 14, 15 or 16 days).10
- It should be noted that not all cruises between Passau and Vienna are recorded at the Jochenstein lock. This is because some operators do not start their trips in the German town of Passau, but in the Austrian town of Engelhartszell, some 2.5 km downstream of Jochenstein. This affects an estimated 25% of all river cruises between Passau and Vienna. As a result, the number of river cruise ships recorded at Jochenstein is lower than the actual number of cruises between Passau and Vienna. The reason for using Engelhartszell is that the landing stages in Passau are sometimes too busy.
- Figure 13 shows the quarterly activity of cruise vessels at the lock of Jochenstein.
- 1,736 river cruise vessels passed through the lock of Jochenstein between January and June 2025 (1,139 during the same period in 2024), which illustrates a strong increase in demand (+52.4%). The number of passengers on the river cruise vessels in the first half year of 2025 amounted to 241,642, an increase of +61.9%. This strong increase follows after the first half year of 2024 when vessel movements and passenger numbers had decreased compared to the previous year.
- A first explanation for the sharp increase in activity at the Jochenstein lock is the continuous growth of the river cruise industry. Secondly, the strong growth in 2025 is also due to the drop of activity in the previous year (see table 2), when high water periods in June and September 2024 were an obstacle for river cruises on the Danube.11 Finally, some operators recently repositioned their vessels towards Passau. Previously, these vessels had been positioned downstream of the Jochenstein lock in Austria. This resulted in additional passages through Jochenstein and could therefore partly explain the sharp increase at that measurement point.
- The number of vessel movements in the first half of 2025 (1,736) was 28.9% higher than in the first half of 2019, the last pre-pandemic first half year.
- River cruise traffic at the other major measurement point along the Danube, increased as well. At the lock of Gabčíkovo, on the border between Slovakia and Hungary, 1,788 river cruise vessels passed through during the first half year 2025 compared to 1,560 vessel movements one year earlier (+14.6%). The number of passengers amounted to 259,000 compared to 209,000 in the first half year of 2024 (+24.1%).
- With regard to long cruises towards the lower Danube, there is, however, less sailing activity on itineraries closer to the Ukrainian border and on parts of the lower Romanian section. Cruises to Constanța continued to operate, but areas closer to Ukraine were more frequently avoided.
- Another important waterway for river cruises in Europe is the Moselle. Data on river cruises are available for three measurement points.12 The highest figures can be observed for the lock of Koblenz, where the Moselle joins the Rhine.
- In the first half of 2025, 417 river cruise vessels passed through the lock of Koblenz. This was an increase of +10.0% compared to the first half of 2024. The result in 2025 was however 13.0% lower than the result in the first half of 2019.
For annual figures, however, pre-pandemic levels have more or less been reached. The number of vessels in 2022 was 1,552, 1,518 in 2023, and 1,538 in 2024, compared to 1,540 in 2019. - Between 2015 and 2024, annual river cruise traffic grew by +17.1% on the Moselle.
FIGURE 12: NUMBER OF RIVER CRUISE VESSELS PASSING THE LOCK OF IFFEZHEIM ON THE UPPER RHINE PER QUARTER AND YEAR
ch1_fig12_raw_data
Source: German Waterways and Shipping Administration (WSV)
FIGURE 13: NUMBER OF RIVER CRUISE VESSELS PASSING THROUGH THE LOCK OF JOCHENSTEIN NEAR PASSAU ON THE UPPER DANUBE PER QUARTER AND YEAR
ch1_fig13_raw_data
Source: German Waterways and Shipping Administration (WSV)
TABLE 3: NUMBER OF PASSENGERS ON RIVER CRUISES ON THE DANUBE PER HALF YEAR
| Measurement point | Number of passengers first half year 2023 | Number of passengers first half year 2024 | Number of passengers first half year 2025 | Rate of change 2025/2024 |
|---|---|---|---|---|
| Jochenstein (Upper Danube, German-Austrian border) | 165,407 | 149,244 | 241,642 | +61.9% |
| Gabčíkovo (Upper Danube, Slovakian-Hungarian border) | 290,900 | 208,700 | 259,000 | +24.1% |
Sources: Danube Commission, German Waterways and Shipping Administration (WSV)
FIGURE 14: NUMBER OF RIVER CRUISE VESSELS PASSING THROUGH THE LOCK OF KOBLENZ ON THE MOSELLE PER QUARTER AND YEAR
ch1_fig14_raw_data
Source: Moselle Commission